Last Update:2025-10-15

ECM

The ECM provides a high-frequency indicator — Real Unit Energy Cost (RUEC) and Real Price Level Index for energy (Real PLI) — to measure and compare real energy cost differentials across nine countries: four in Asia (China, India, Japan, and Korea), and four in Europe (France, Germany, Italy, and the UK), and the U.S. The ECM also releases the EITE (Energy-Intensive Trade-Exposed) Output Index.

Highlights from ECM202509

  • Real PLIs indicate that the real energy price differentials against the U.S. have widened by 15-24% compared with 2015–2019 average.
  • While energy prices have declined from their peak, they continue to hover around 20% to 80% above the 2015 level.
  • Except for India and China, EITE output remains sluggish, down by about 7% to 35% from 2015 levels.

RUEC (Real Unit Energy Cost)

RUEC Levels
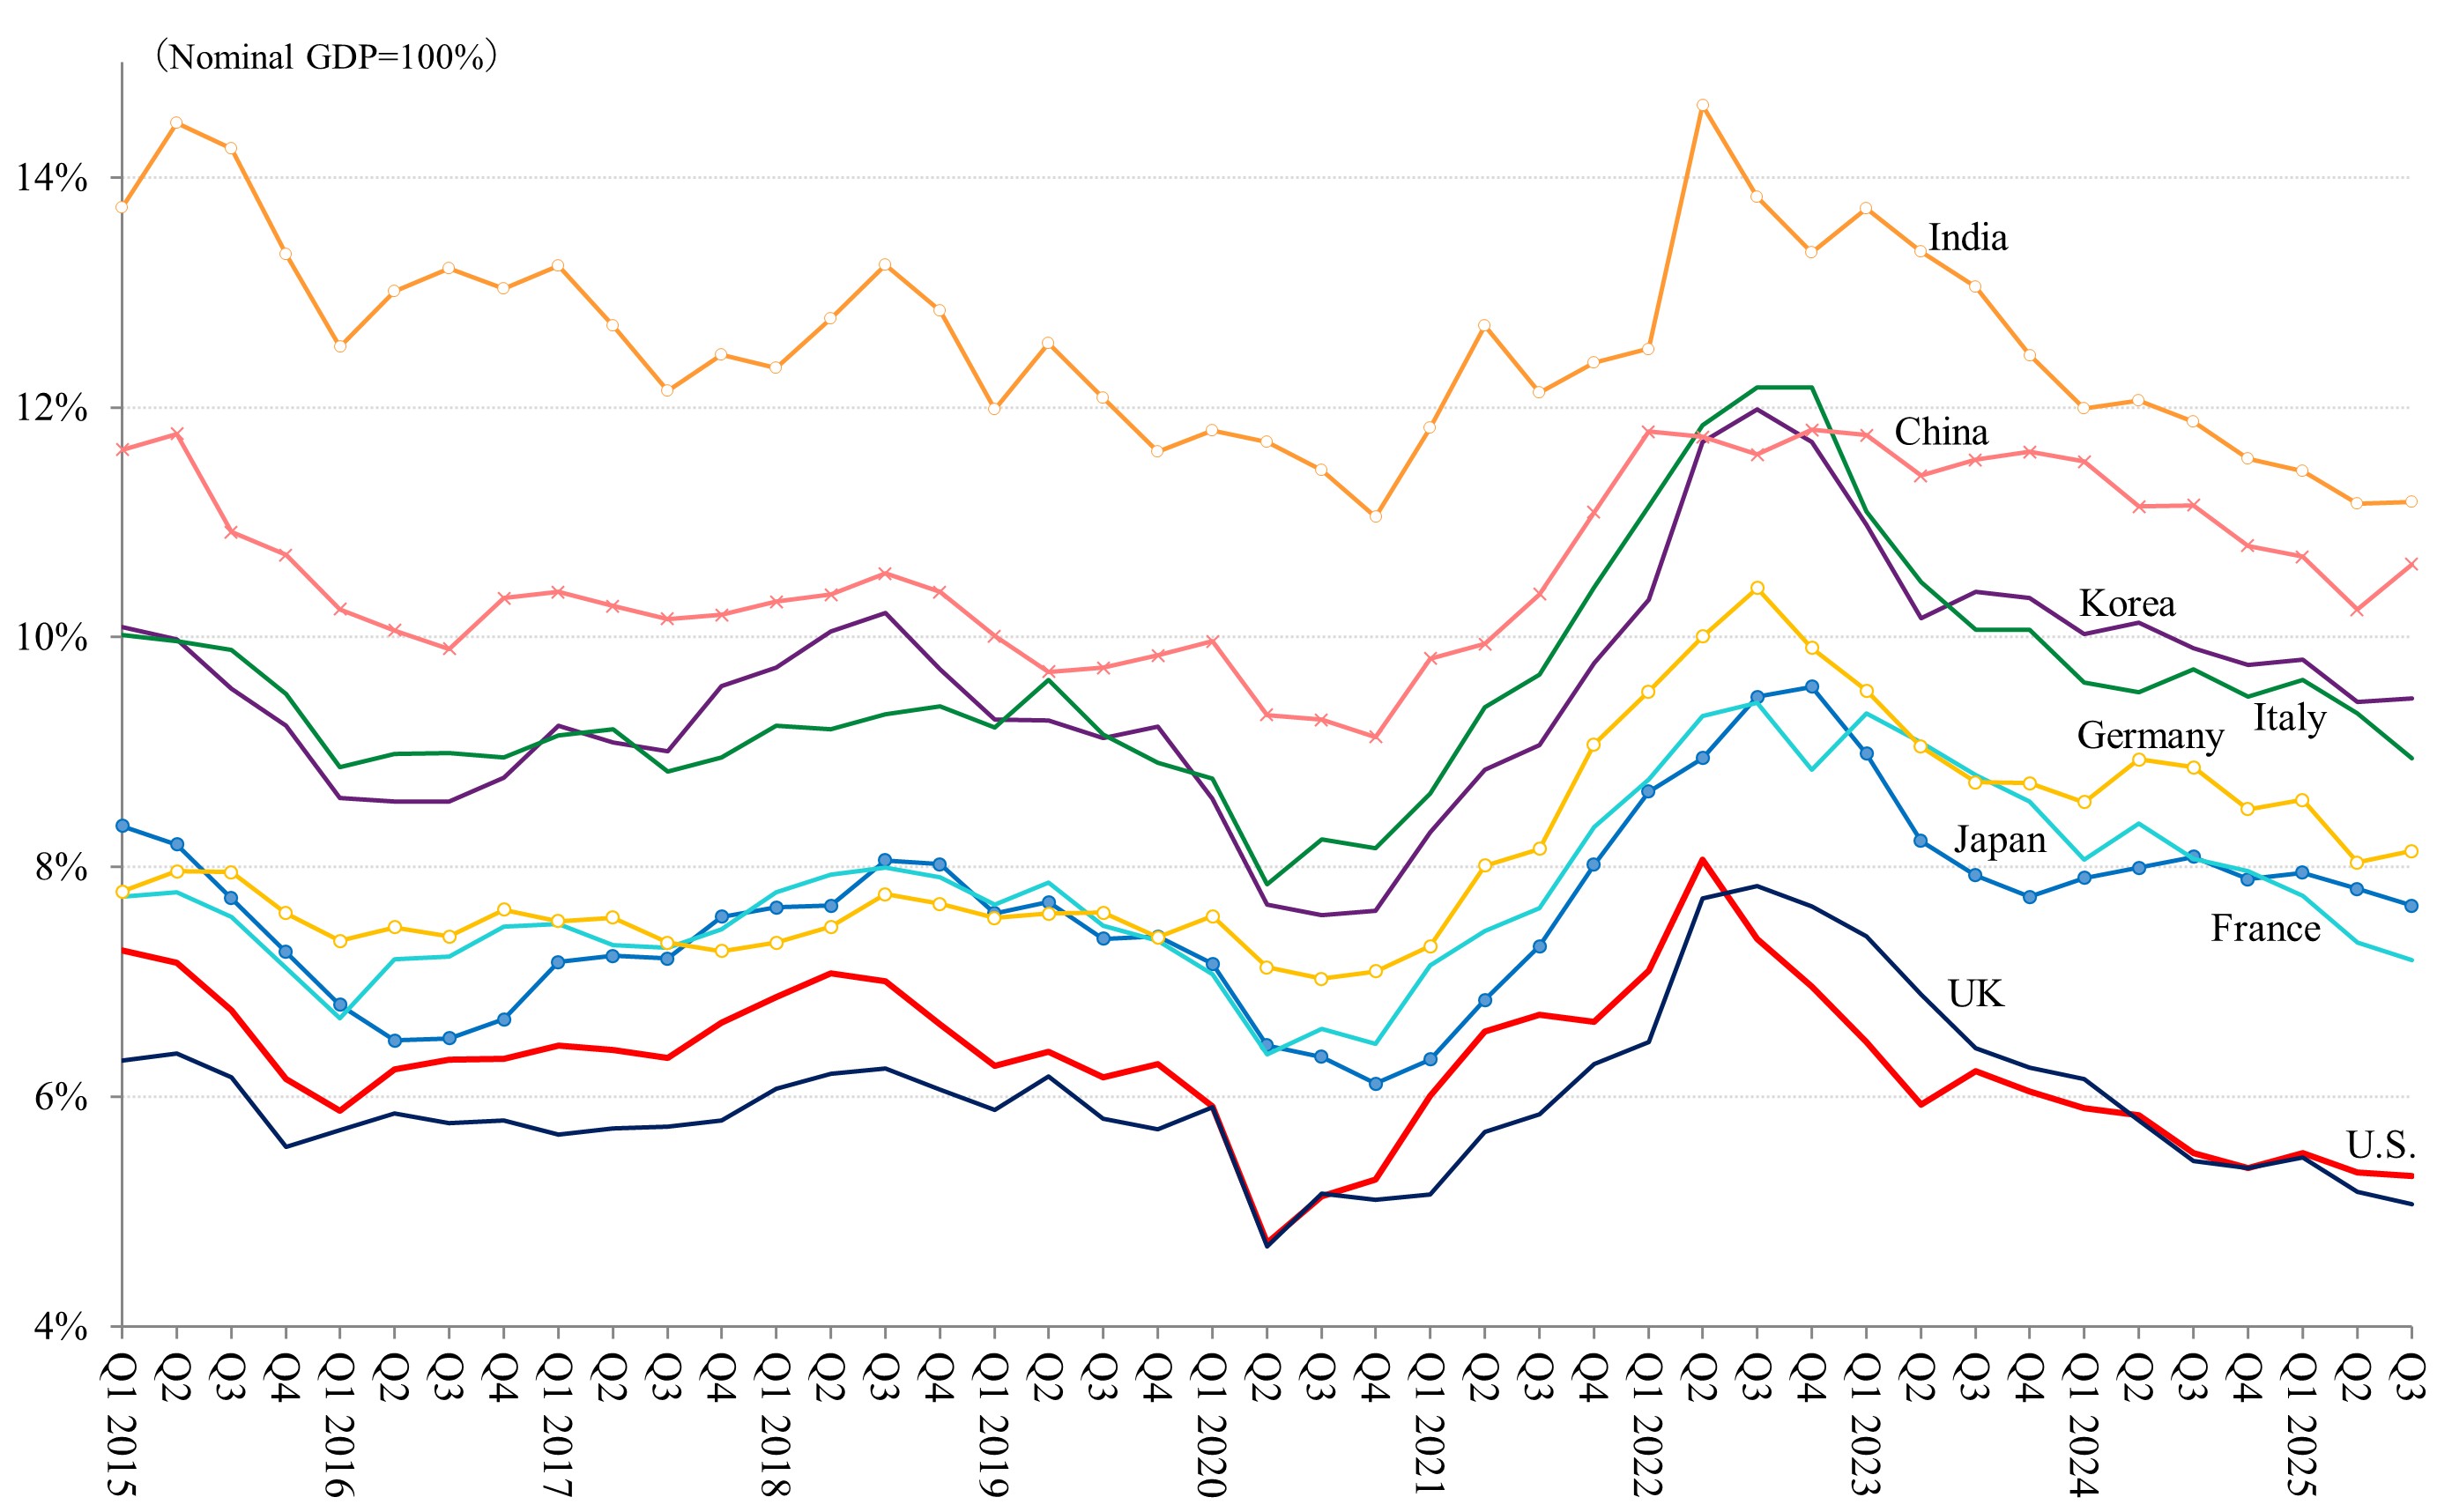
Unit: Share (GDP at current market prices in each period=100% in each country). Period: Q1 2015–Q2 2025. Notes: The prices are seasonally adjusted and include taxes and subsidies. The volumes are seasonally adjusted.

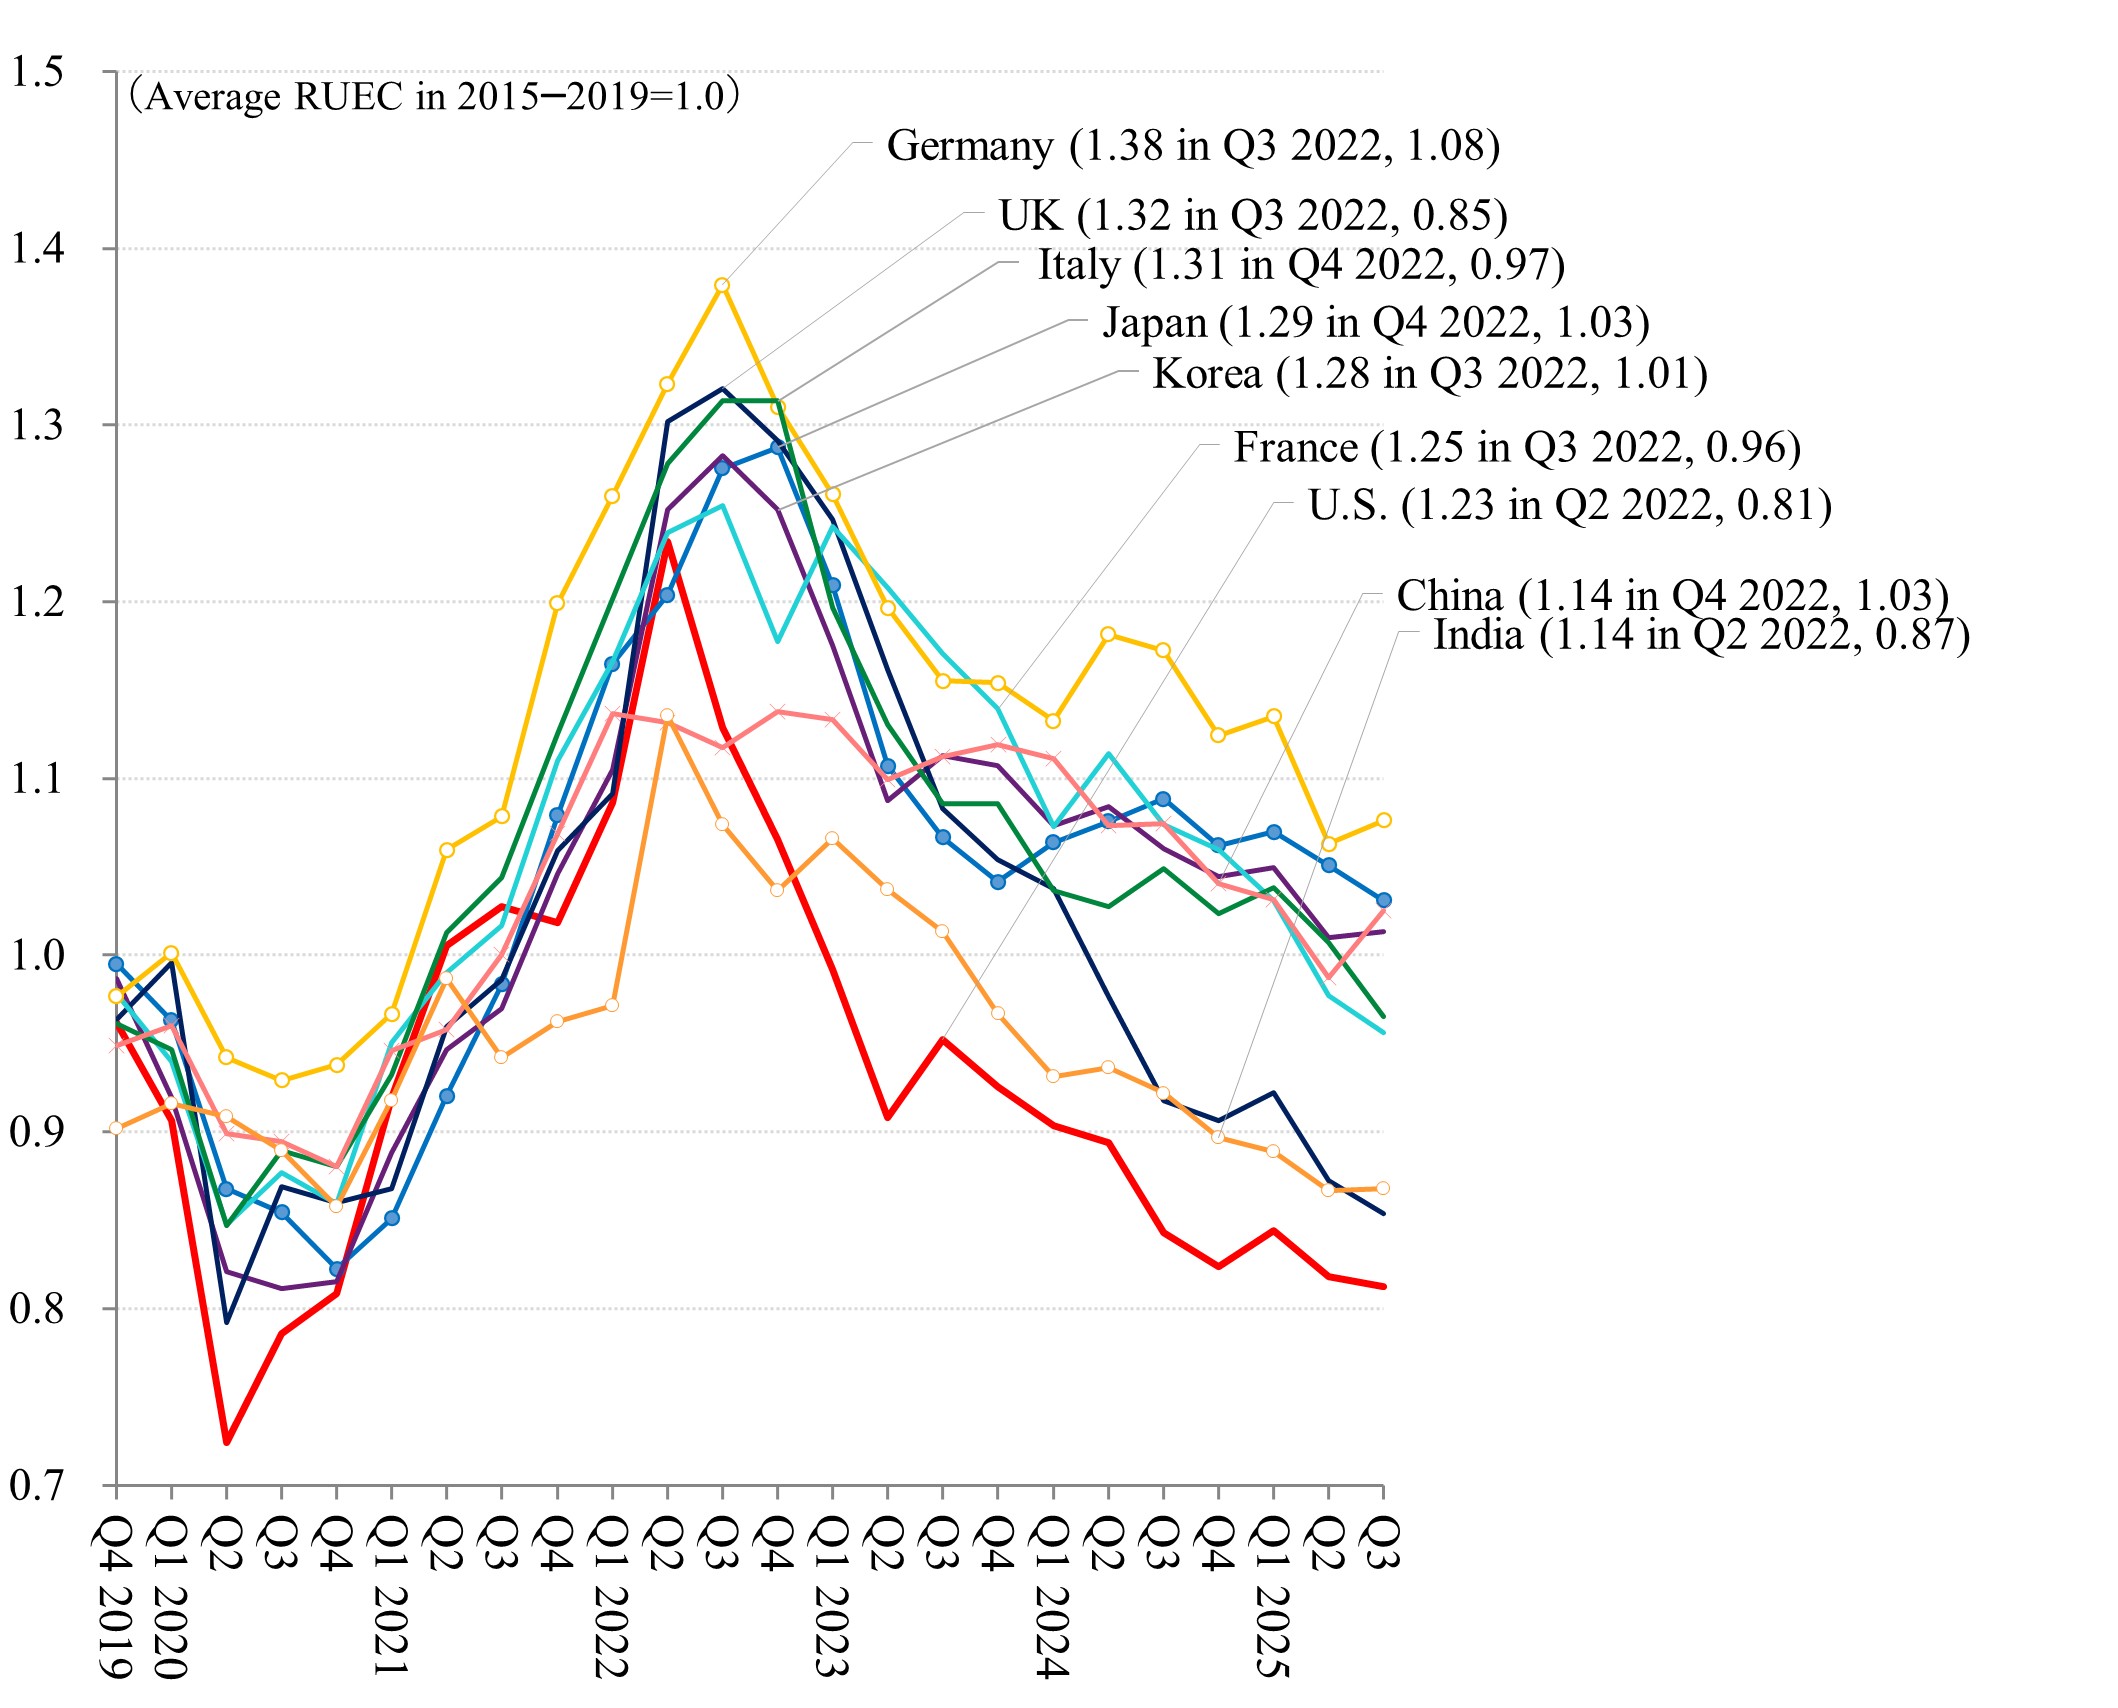
Post-Pandemic RUEC Indices

Unit: Index (average RUEC in 2015–2019=1.0 in each country). Period: Q4 2019–Q2 2025. Notes: The counts after the country name indicate the peaks in RUEC surges and the recovered level as of Q2 2025 relative to the pre-pandemic level. The prices are seasonally adjusted and include taxes and subsidies. The volumes are seasonally adjusted.

RUEC Decomposition

Asia (China, India, Japan, and Korea)
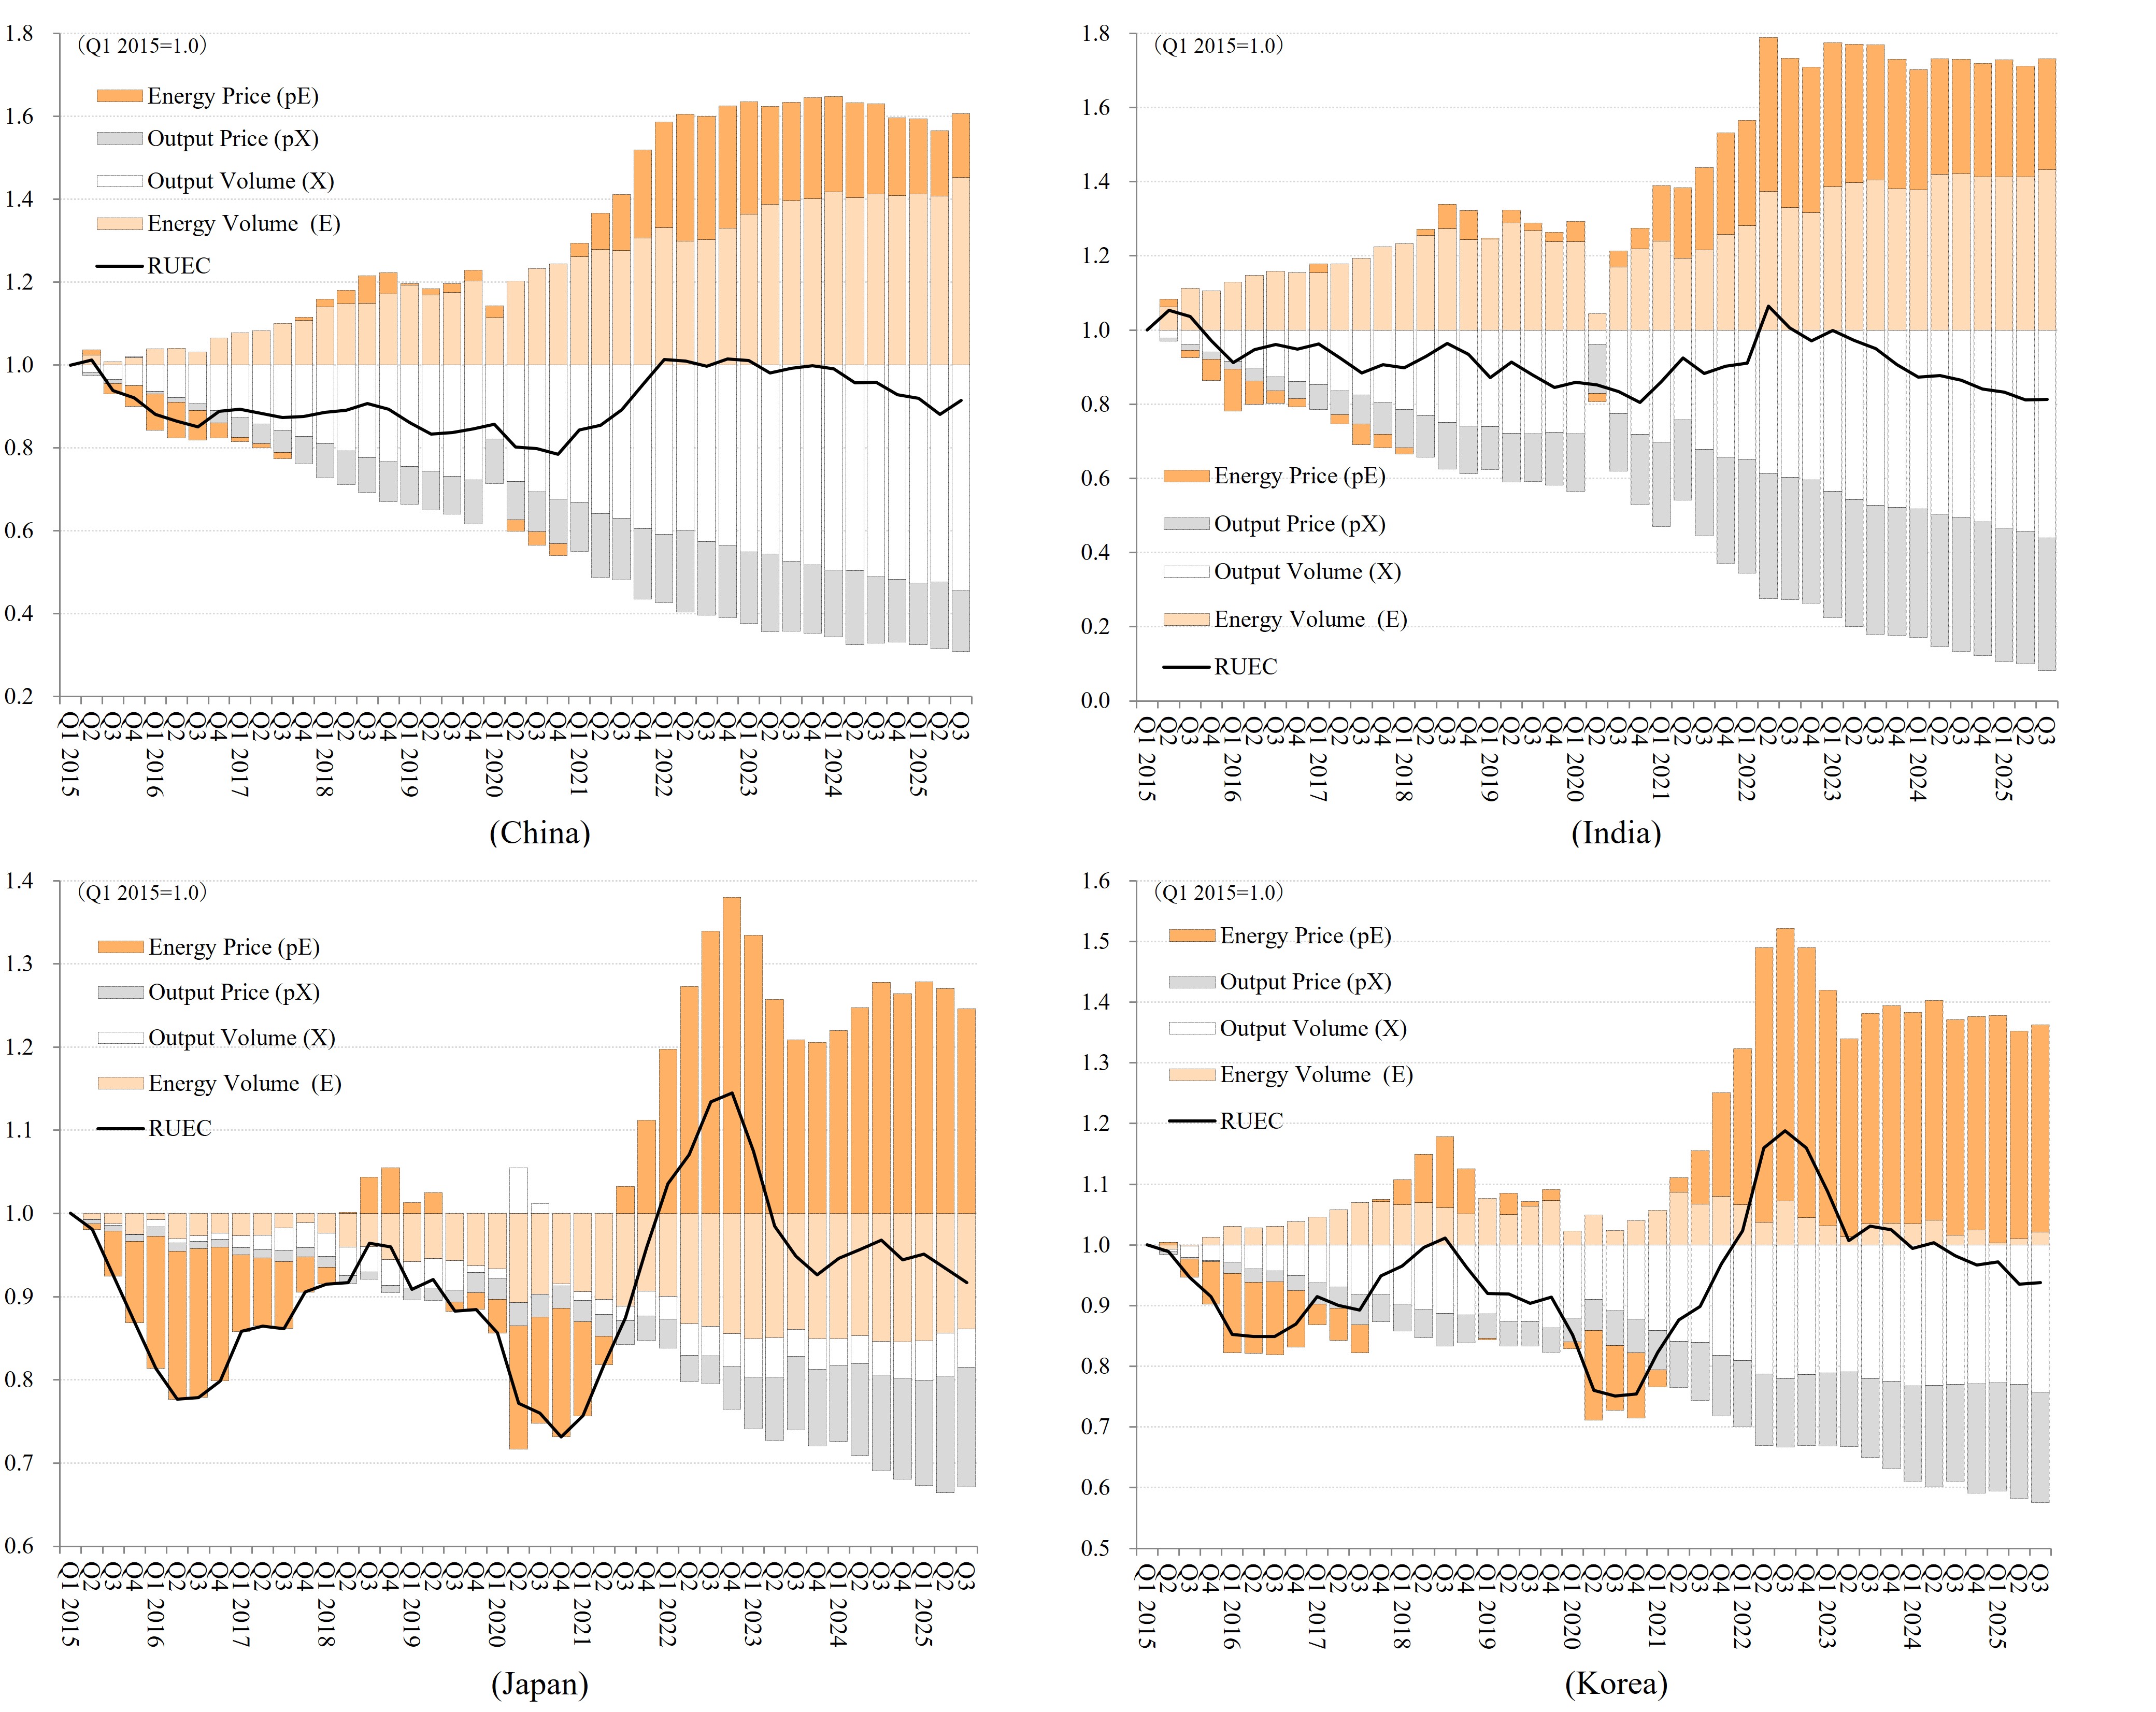
Unit: Index (RUEC in Q1 2015=1.0). Period: Q1 2015–Q2 2025. Notes: The prices are seasonally adjusted and include taxes and subsidies. The volumes are seasonally adjusted.

EU (France, Germany, and Italy), the UK, and the U.S.
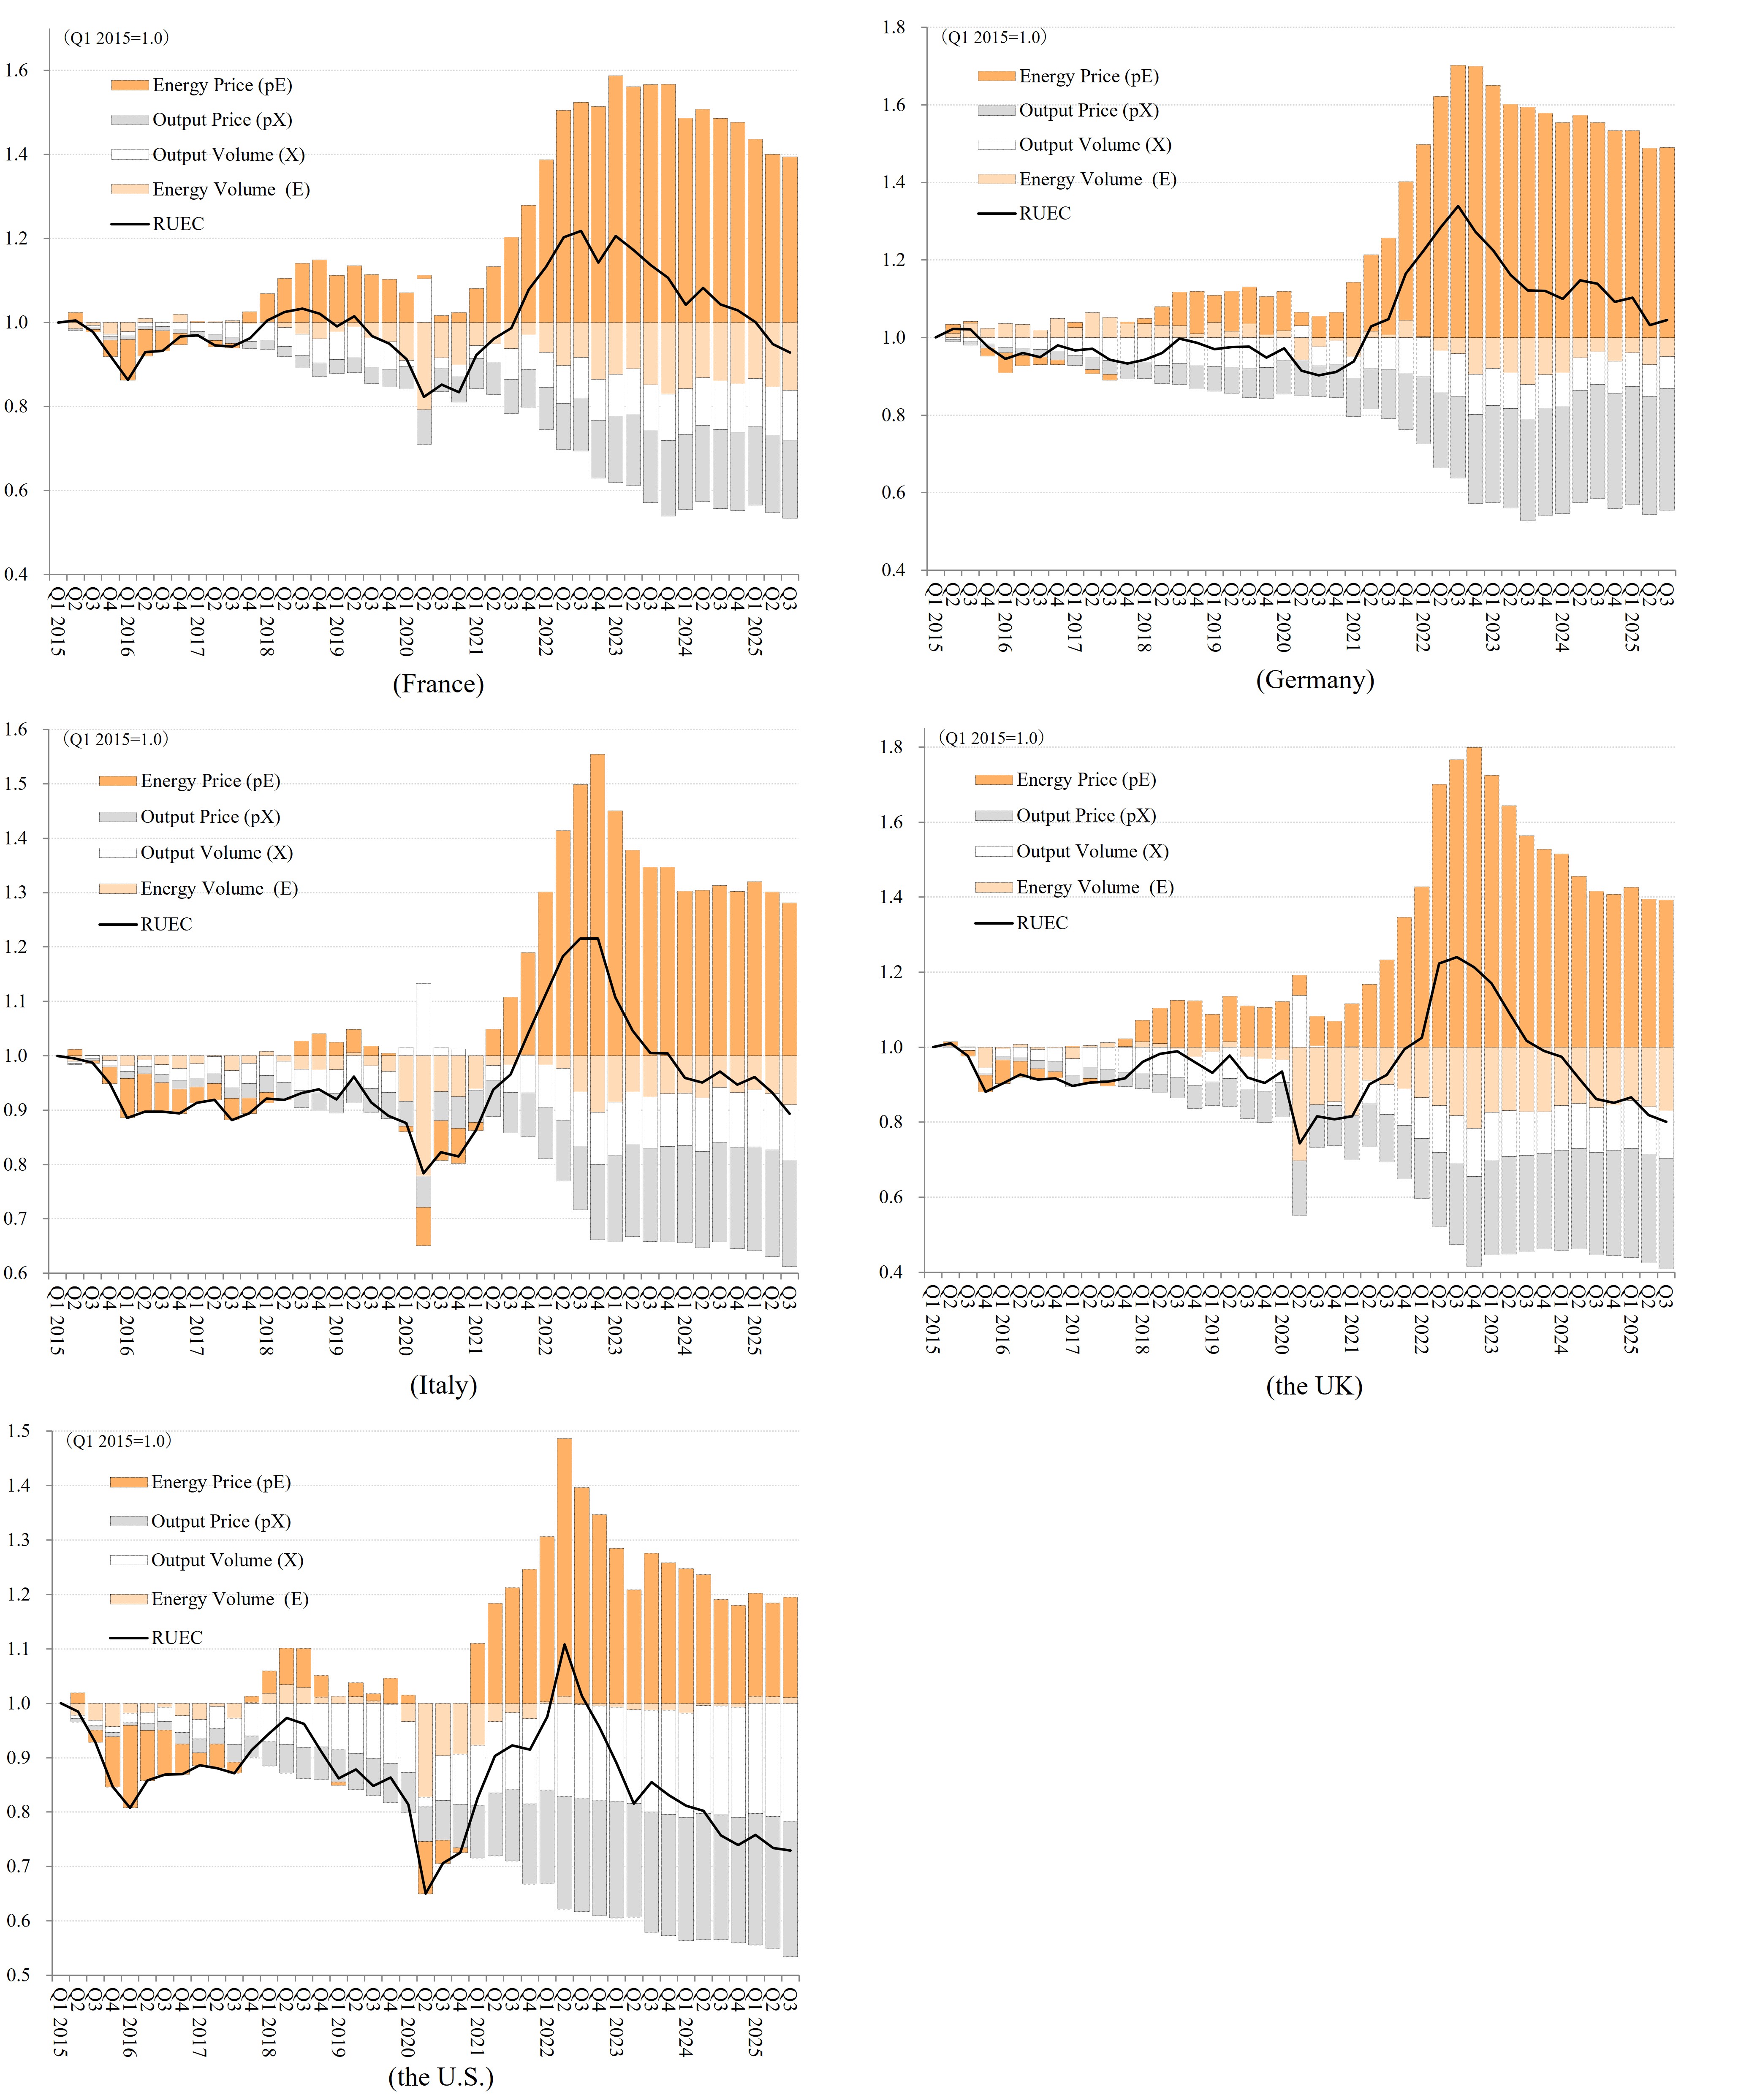
Unit: Index (RUEC in Q1 2015=1.0). Period: Q1 2015–Q2 2025. Notes: The prices are seasonally adjusted and include taxes and subsidies. The volumes are seasonally adjusted.