Last Update:2025-10-15

ECM

The ECM provides a high-frequency indicator — Real Unit Energy Cost (RUEC) and Real Price Level Index for energy (Real PLI) — to measure and compare real energy cost differentials across nine countries: four in Asia (China, India, Japan, and Korea), and four in Europe (France, Germany, Italy, and the UK), and the U.S. The ECM also releases the EITE (Energy-Intensive Trade-Exposed) Output Index.

Highlights from ECM202509

  • Real PLIs indicate that the real energy price differentials against the U.S. have widened by 15-24% compared with 2015–2019 average.
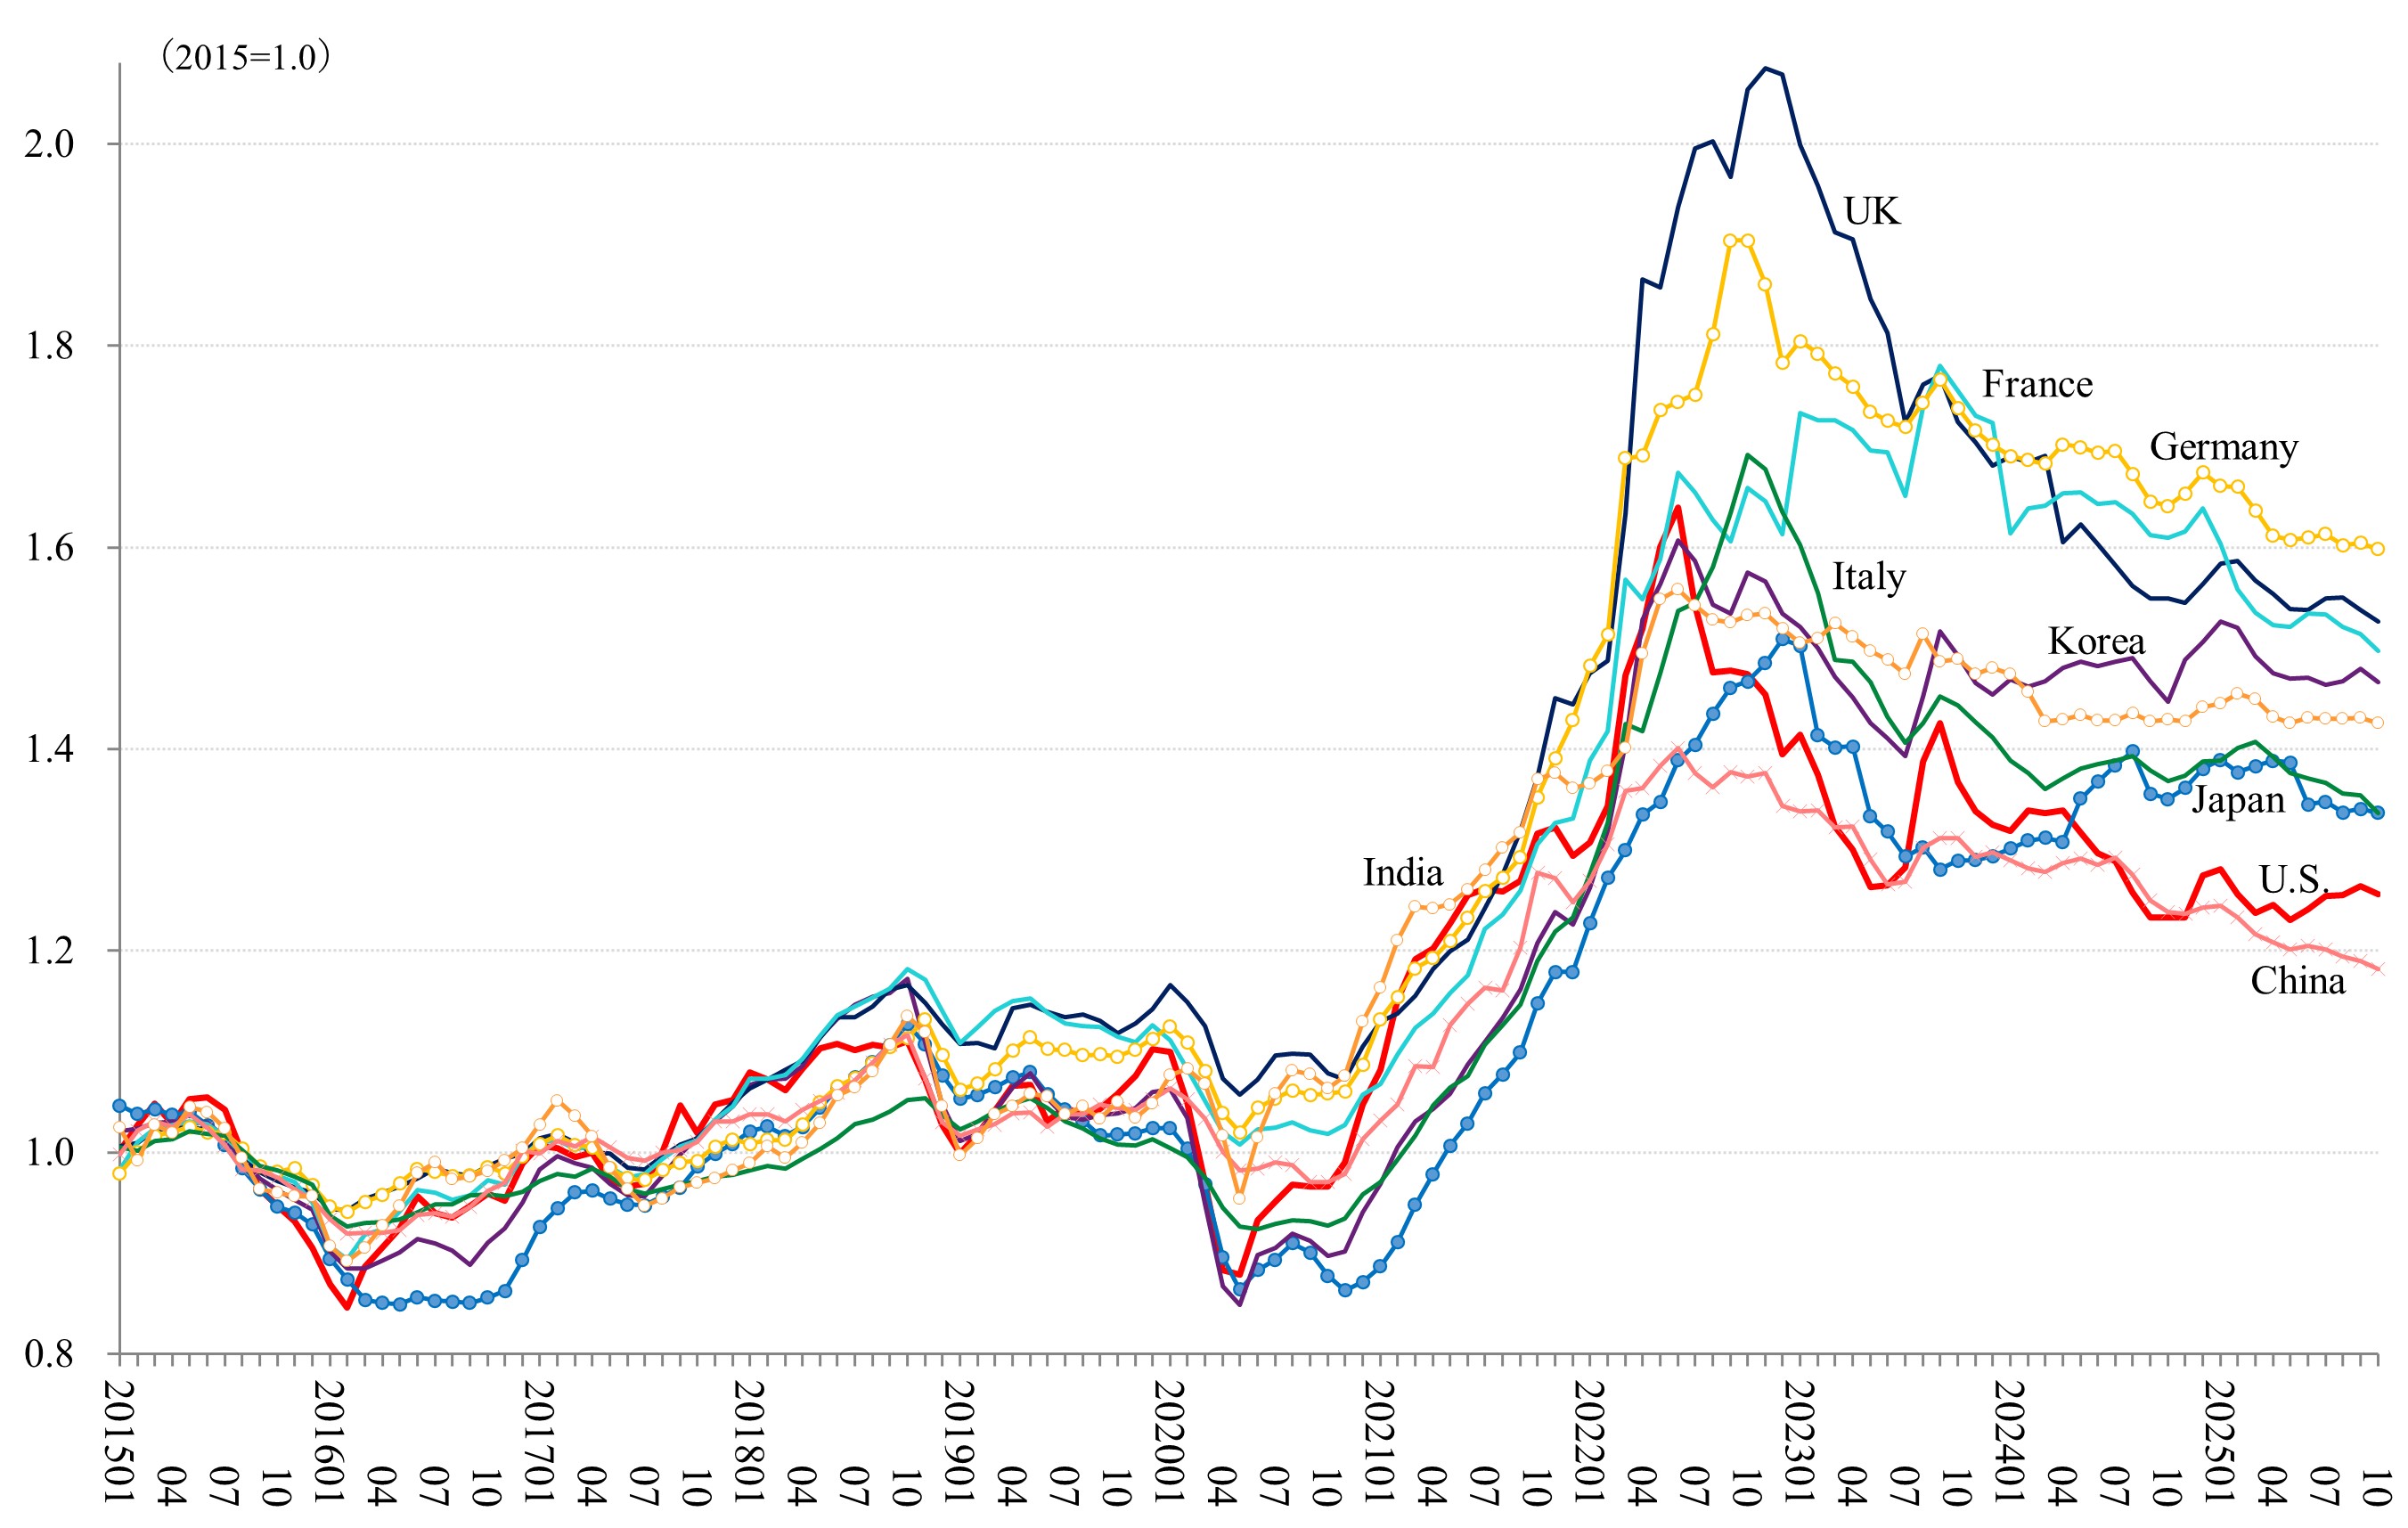
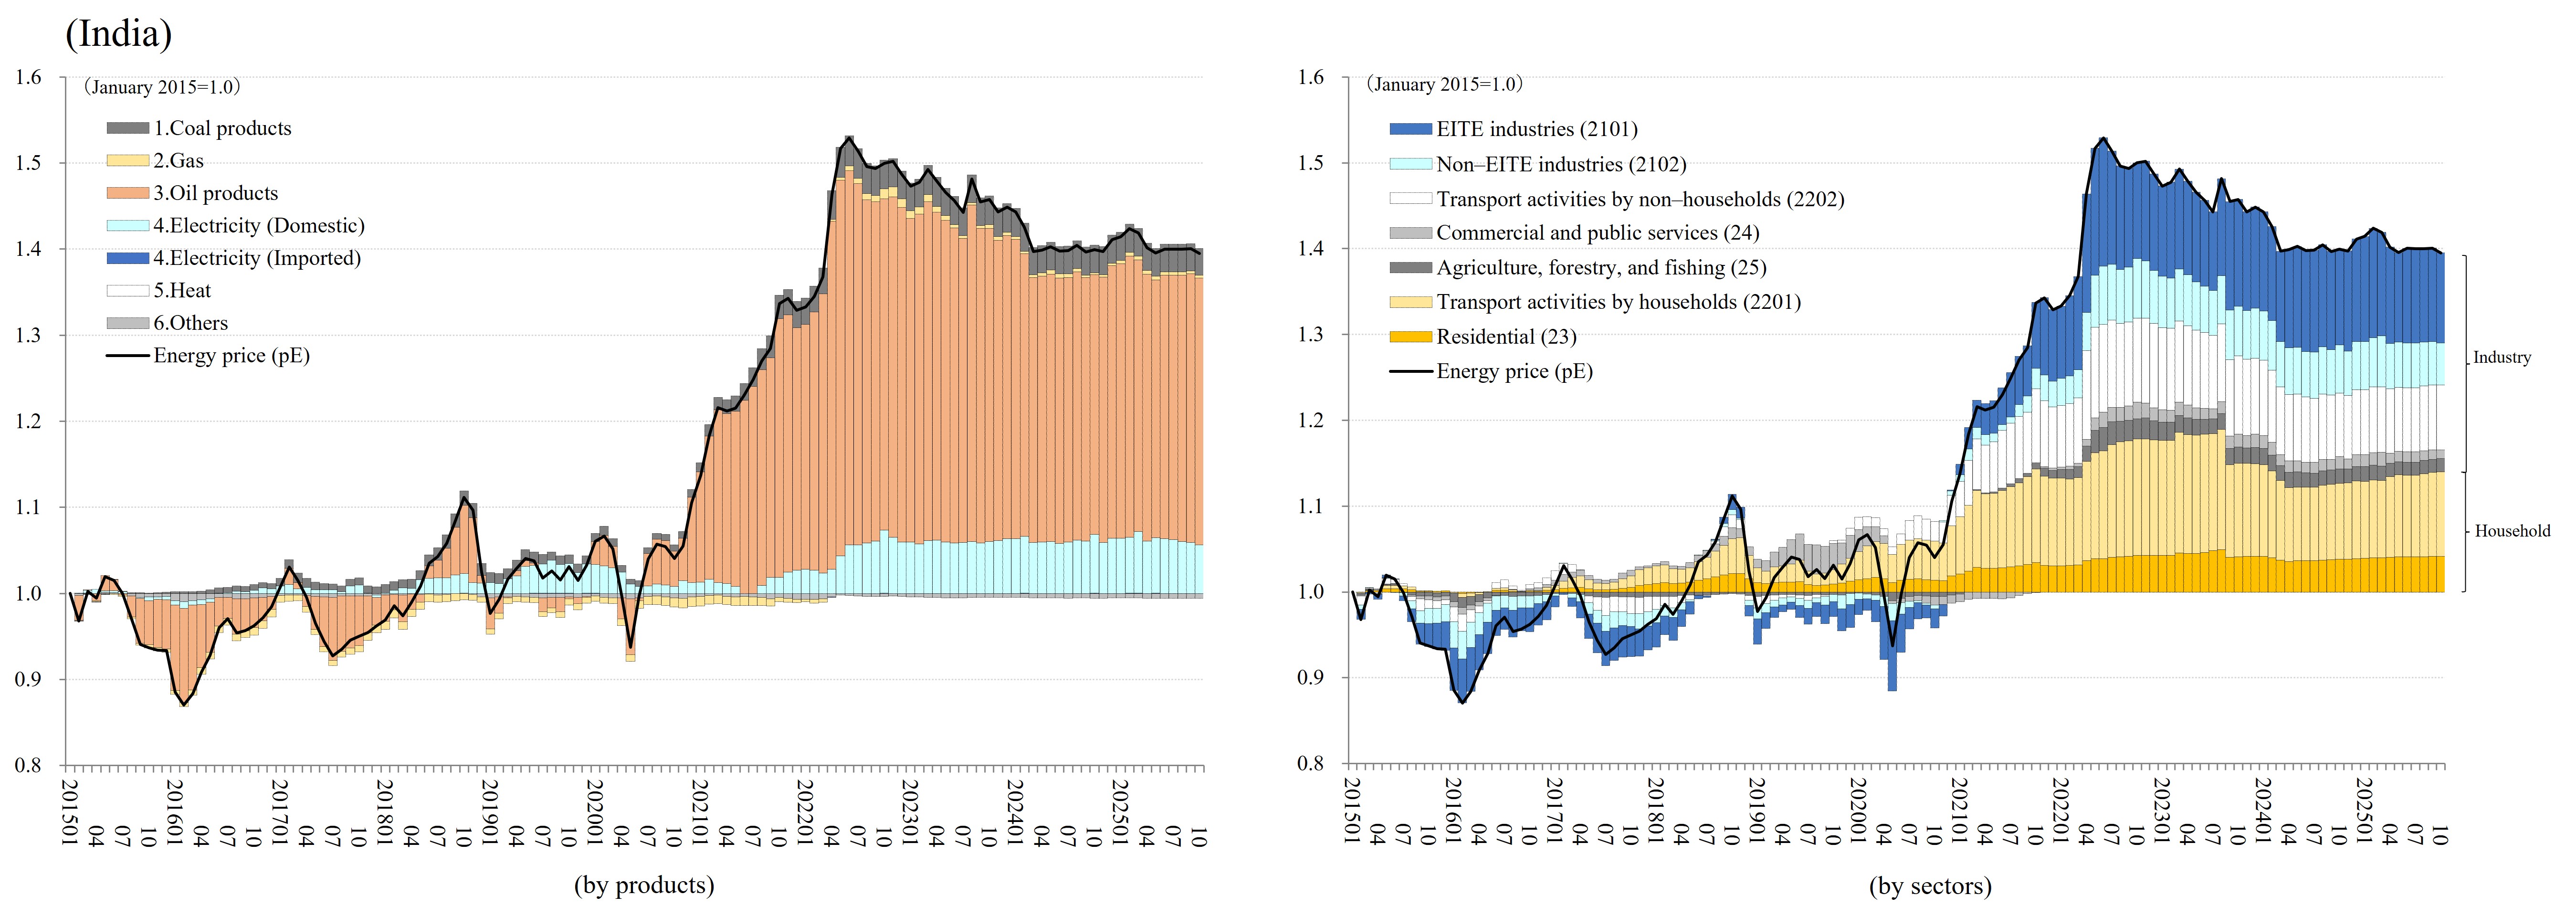
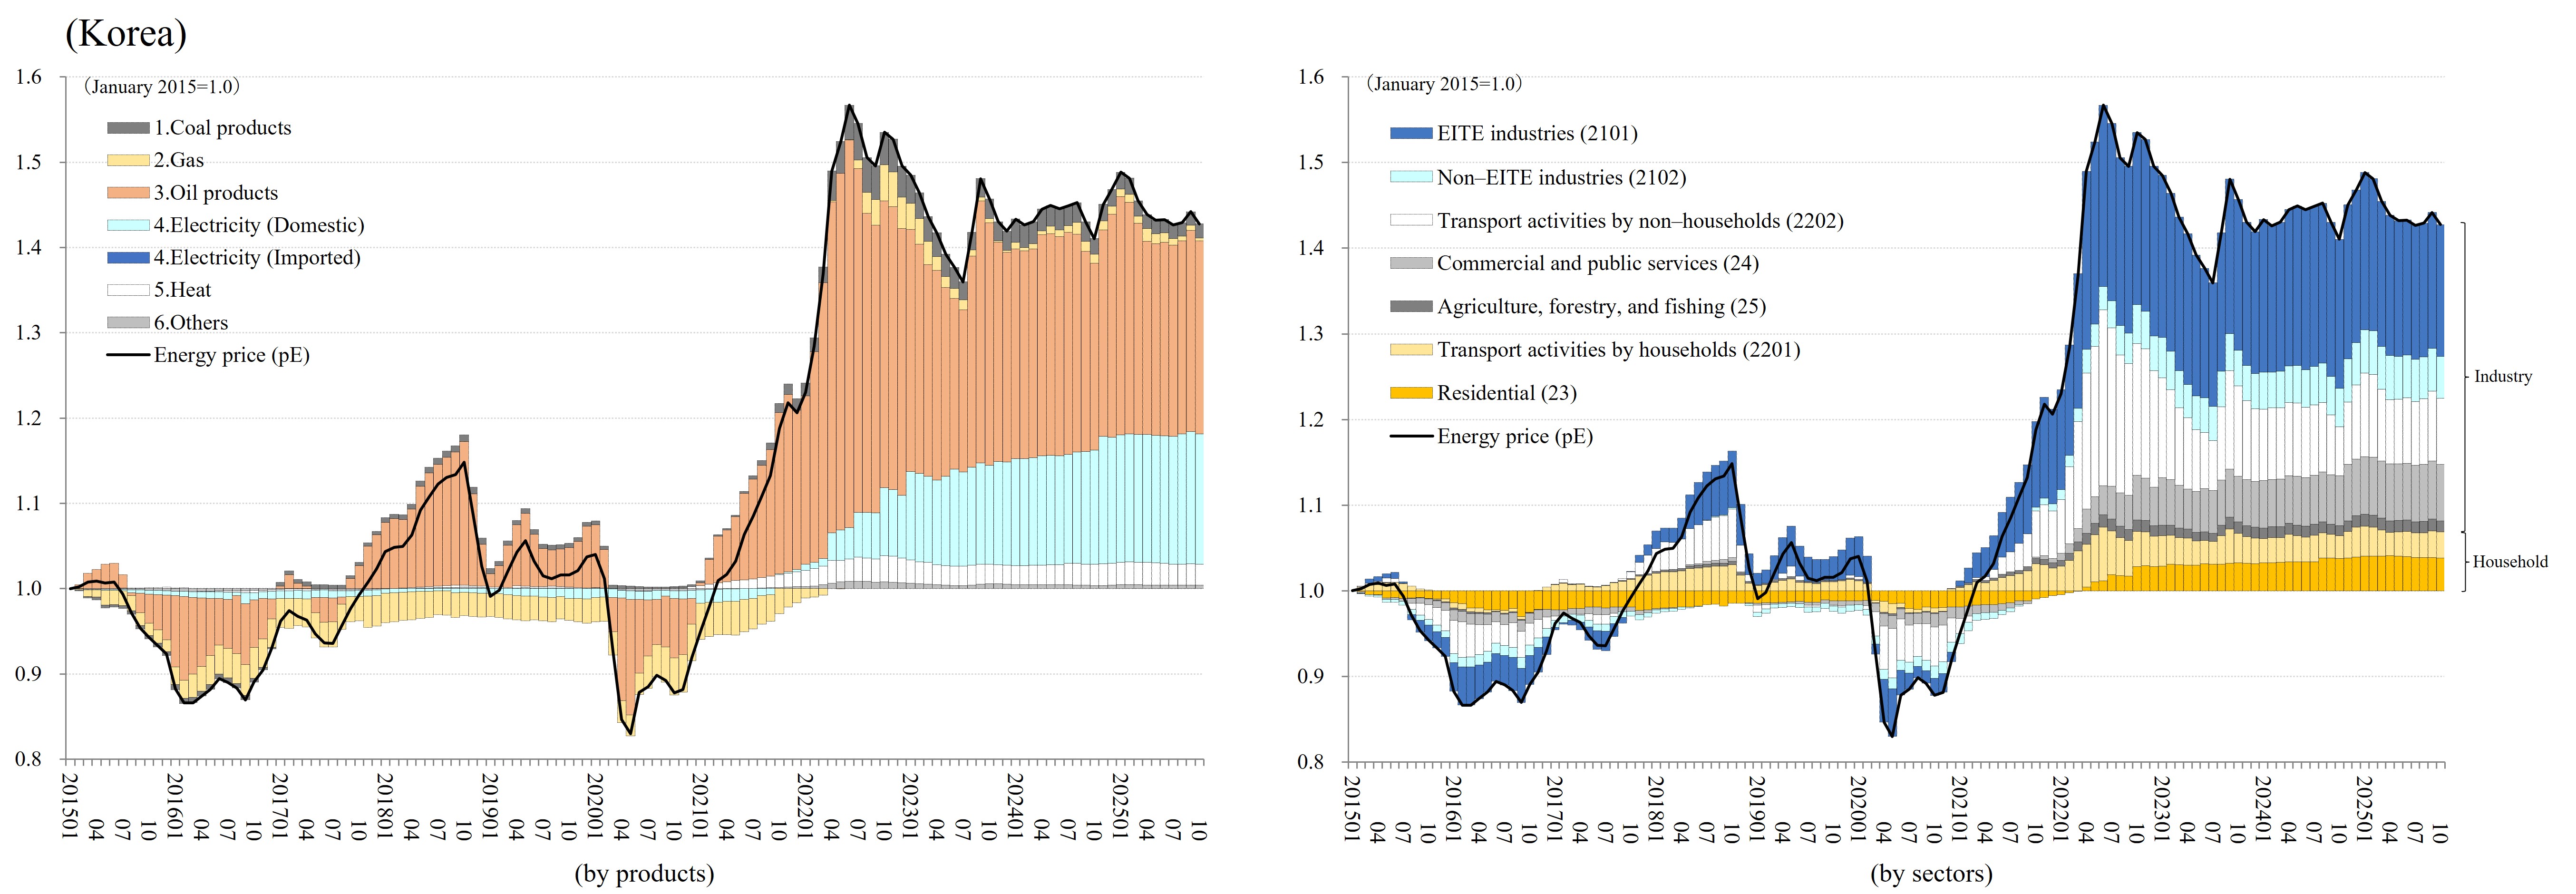
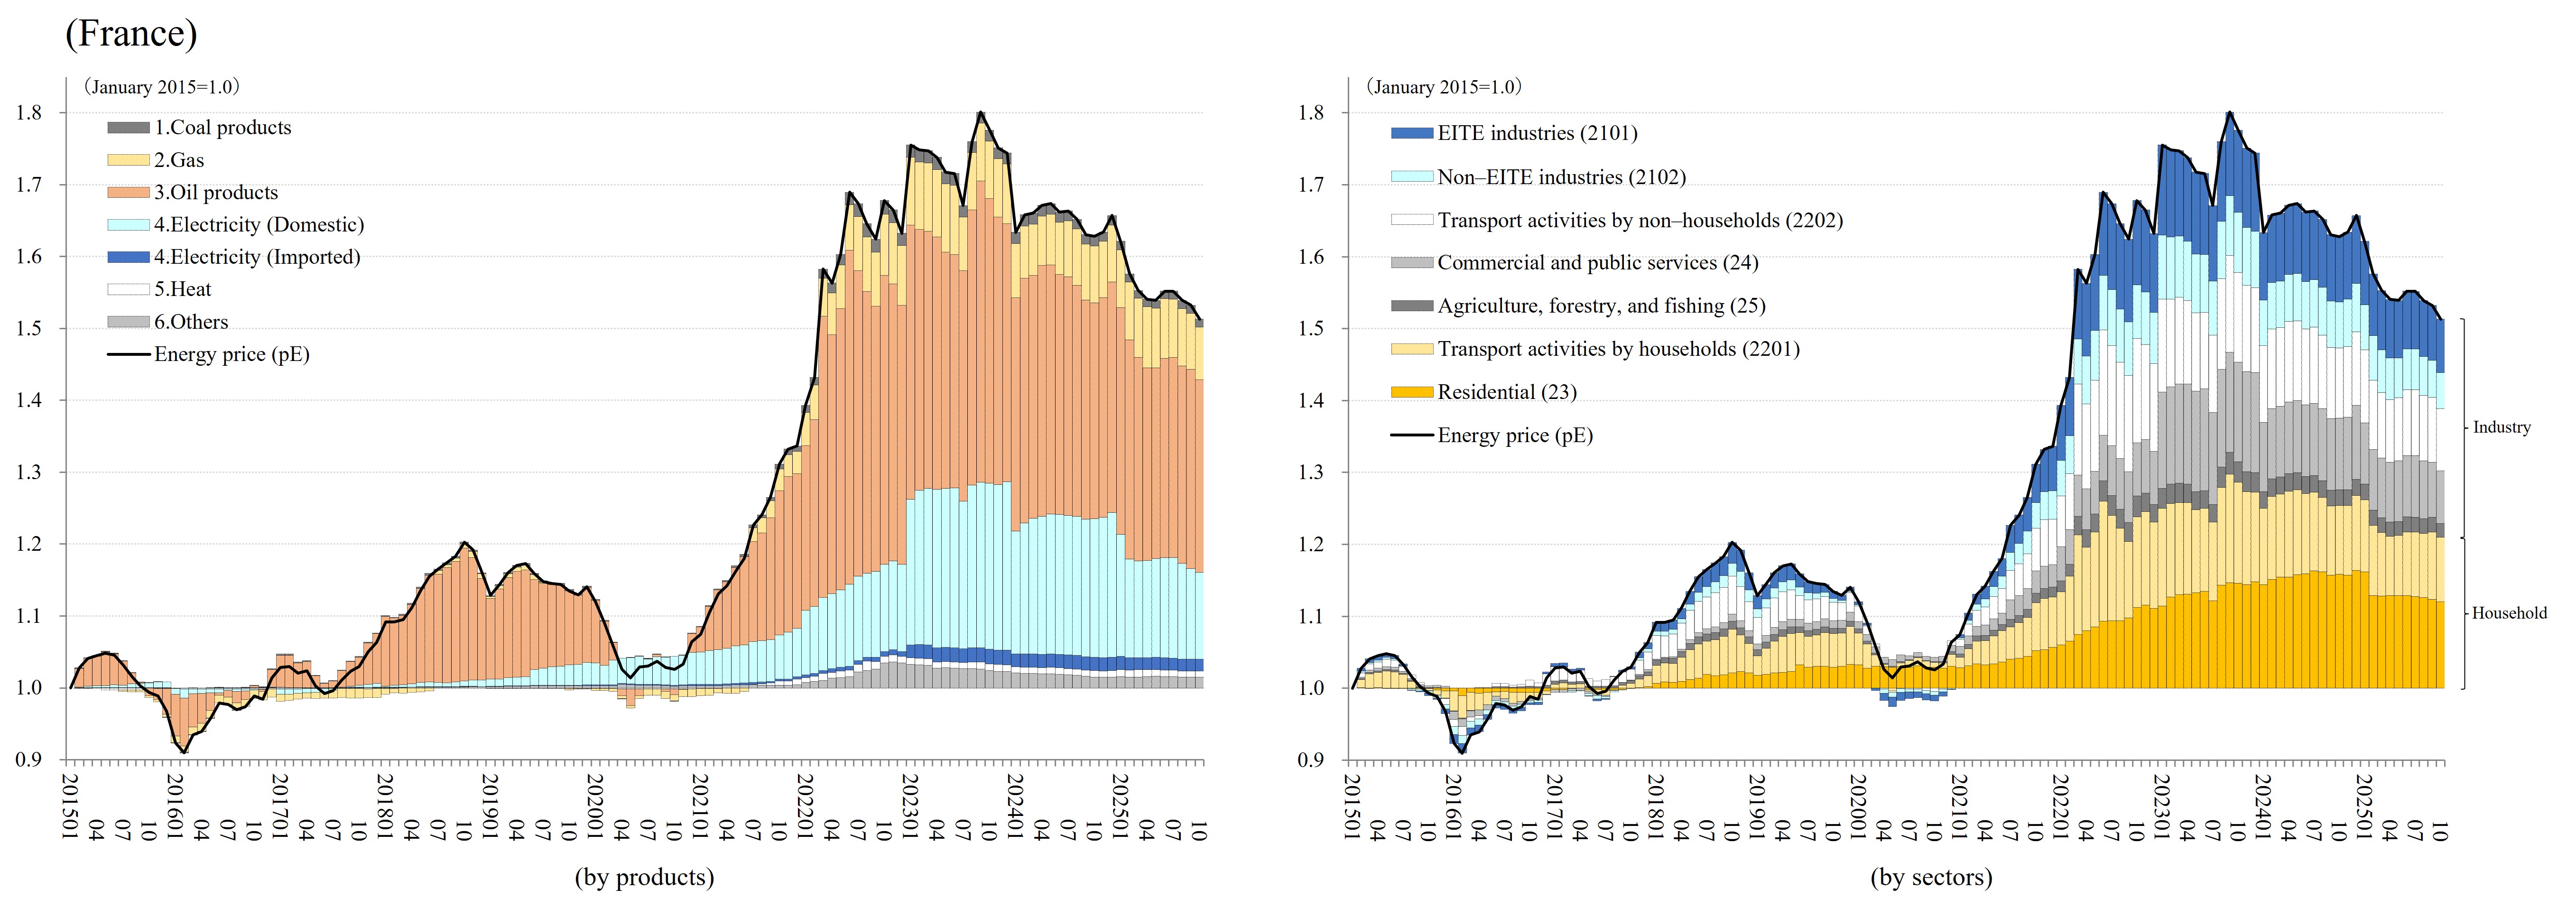
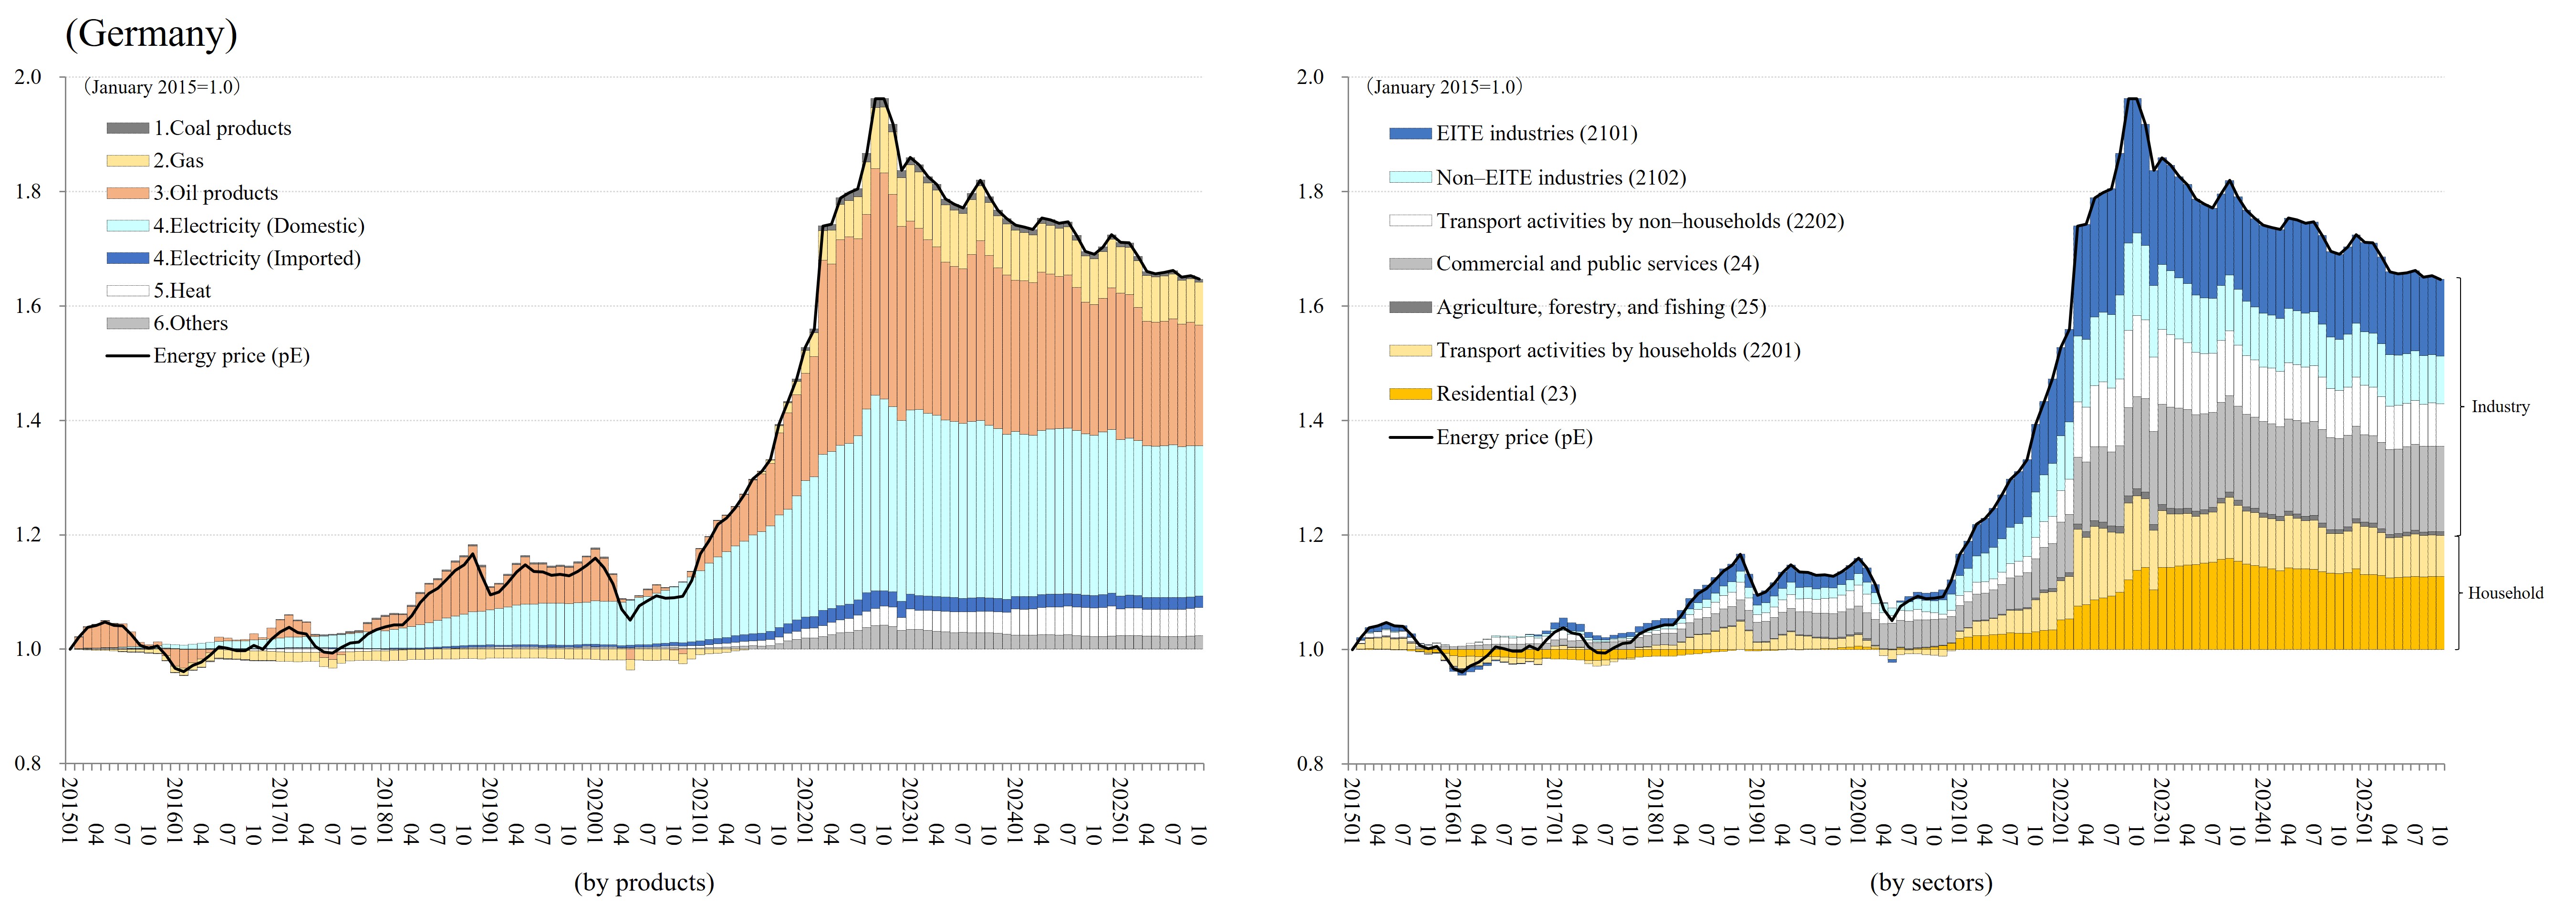
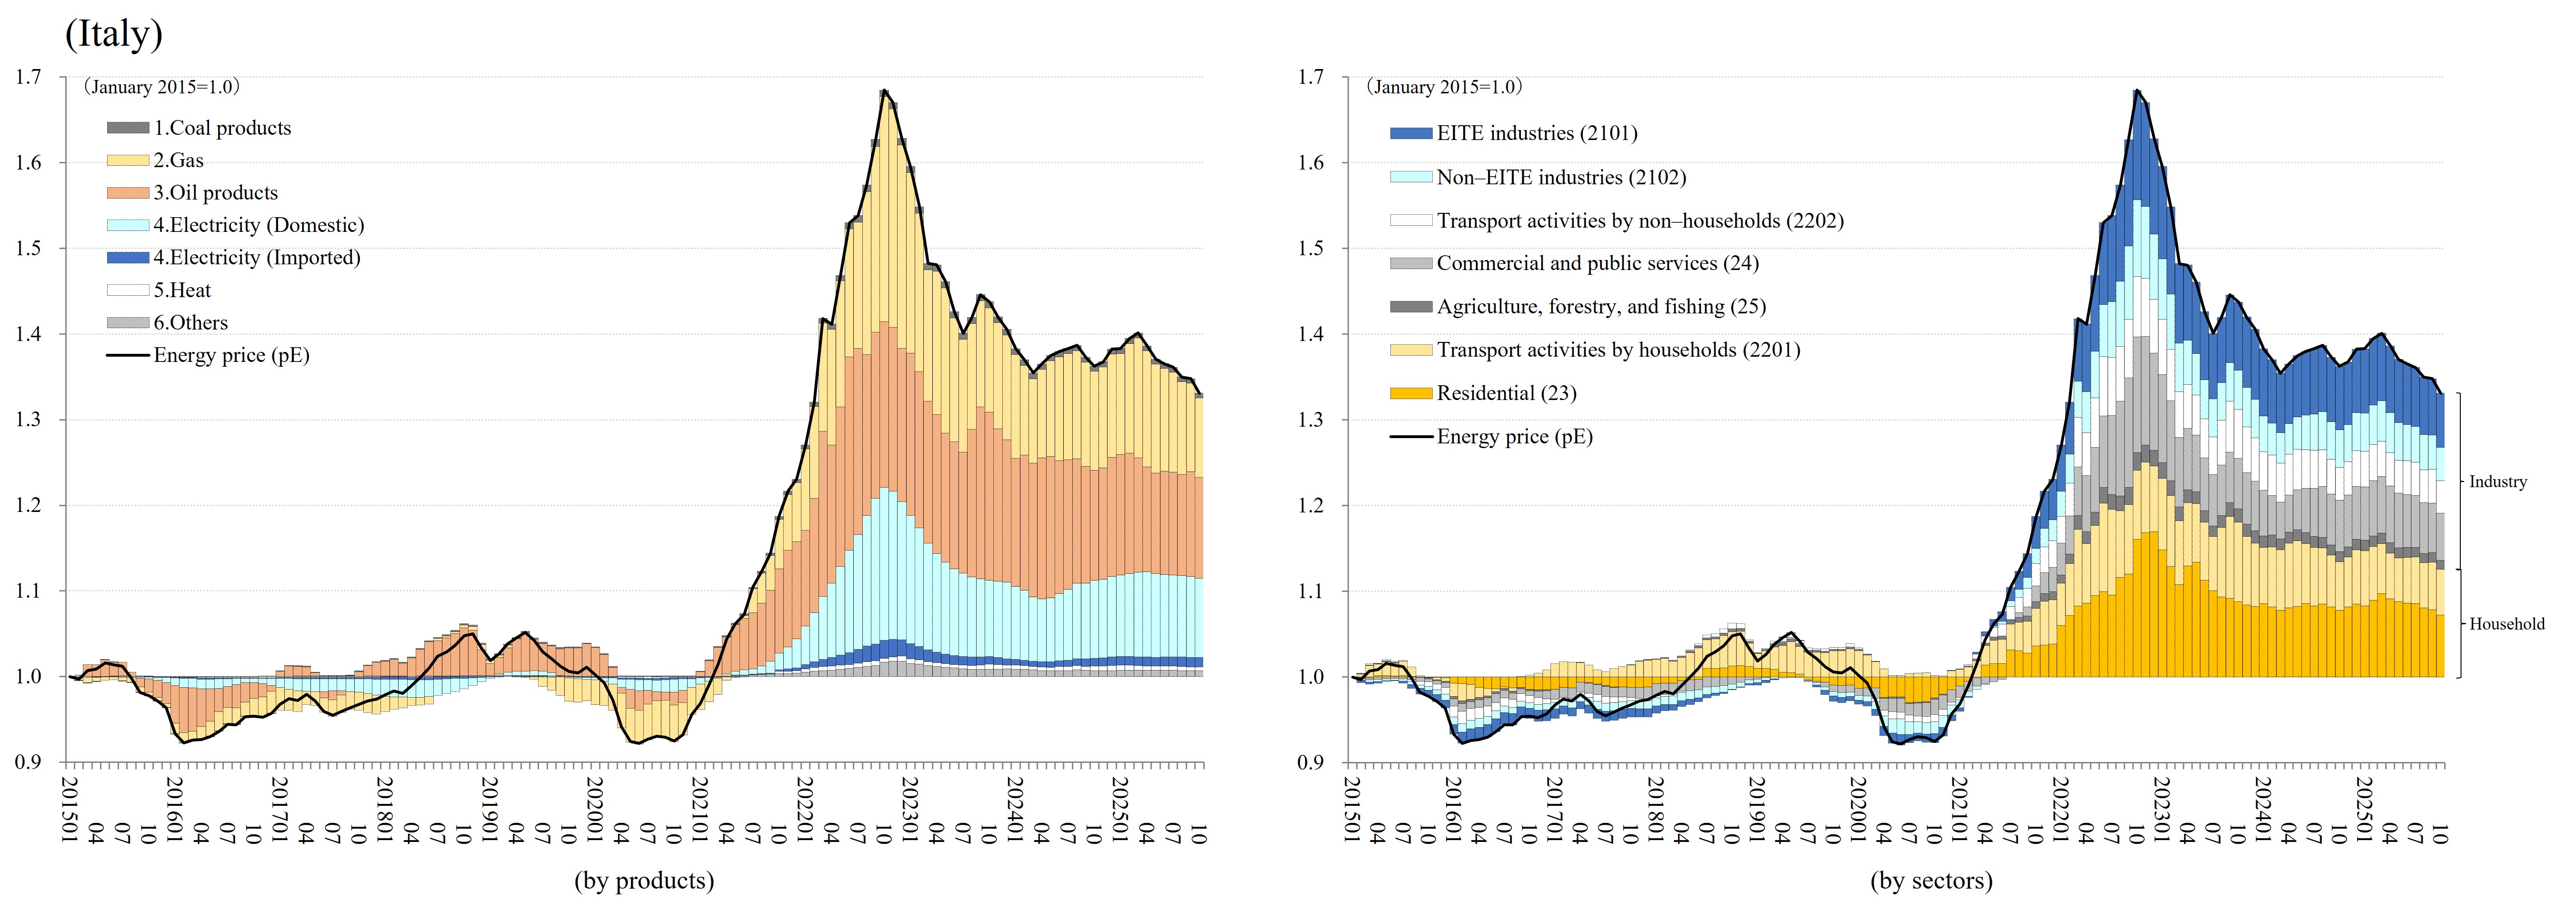
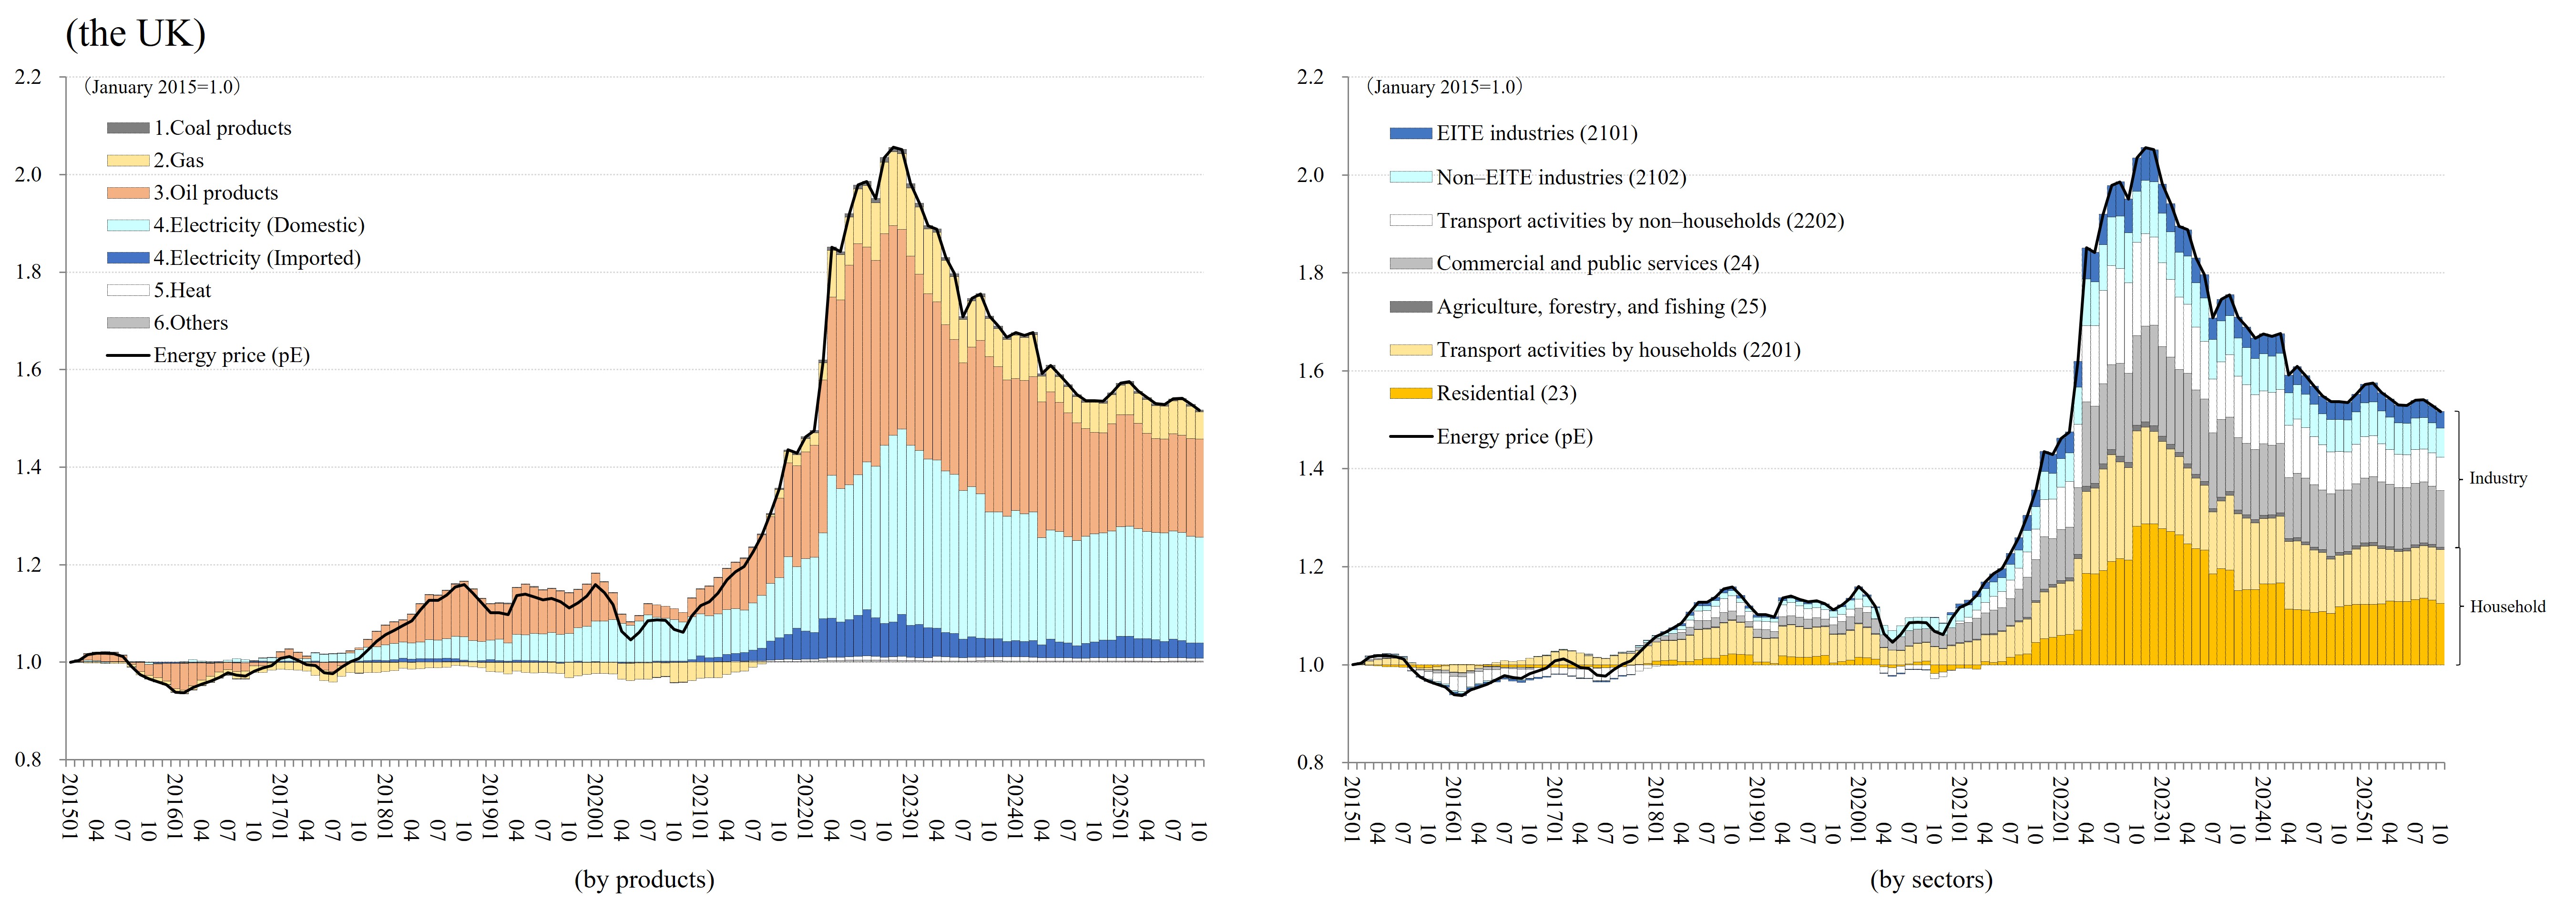
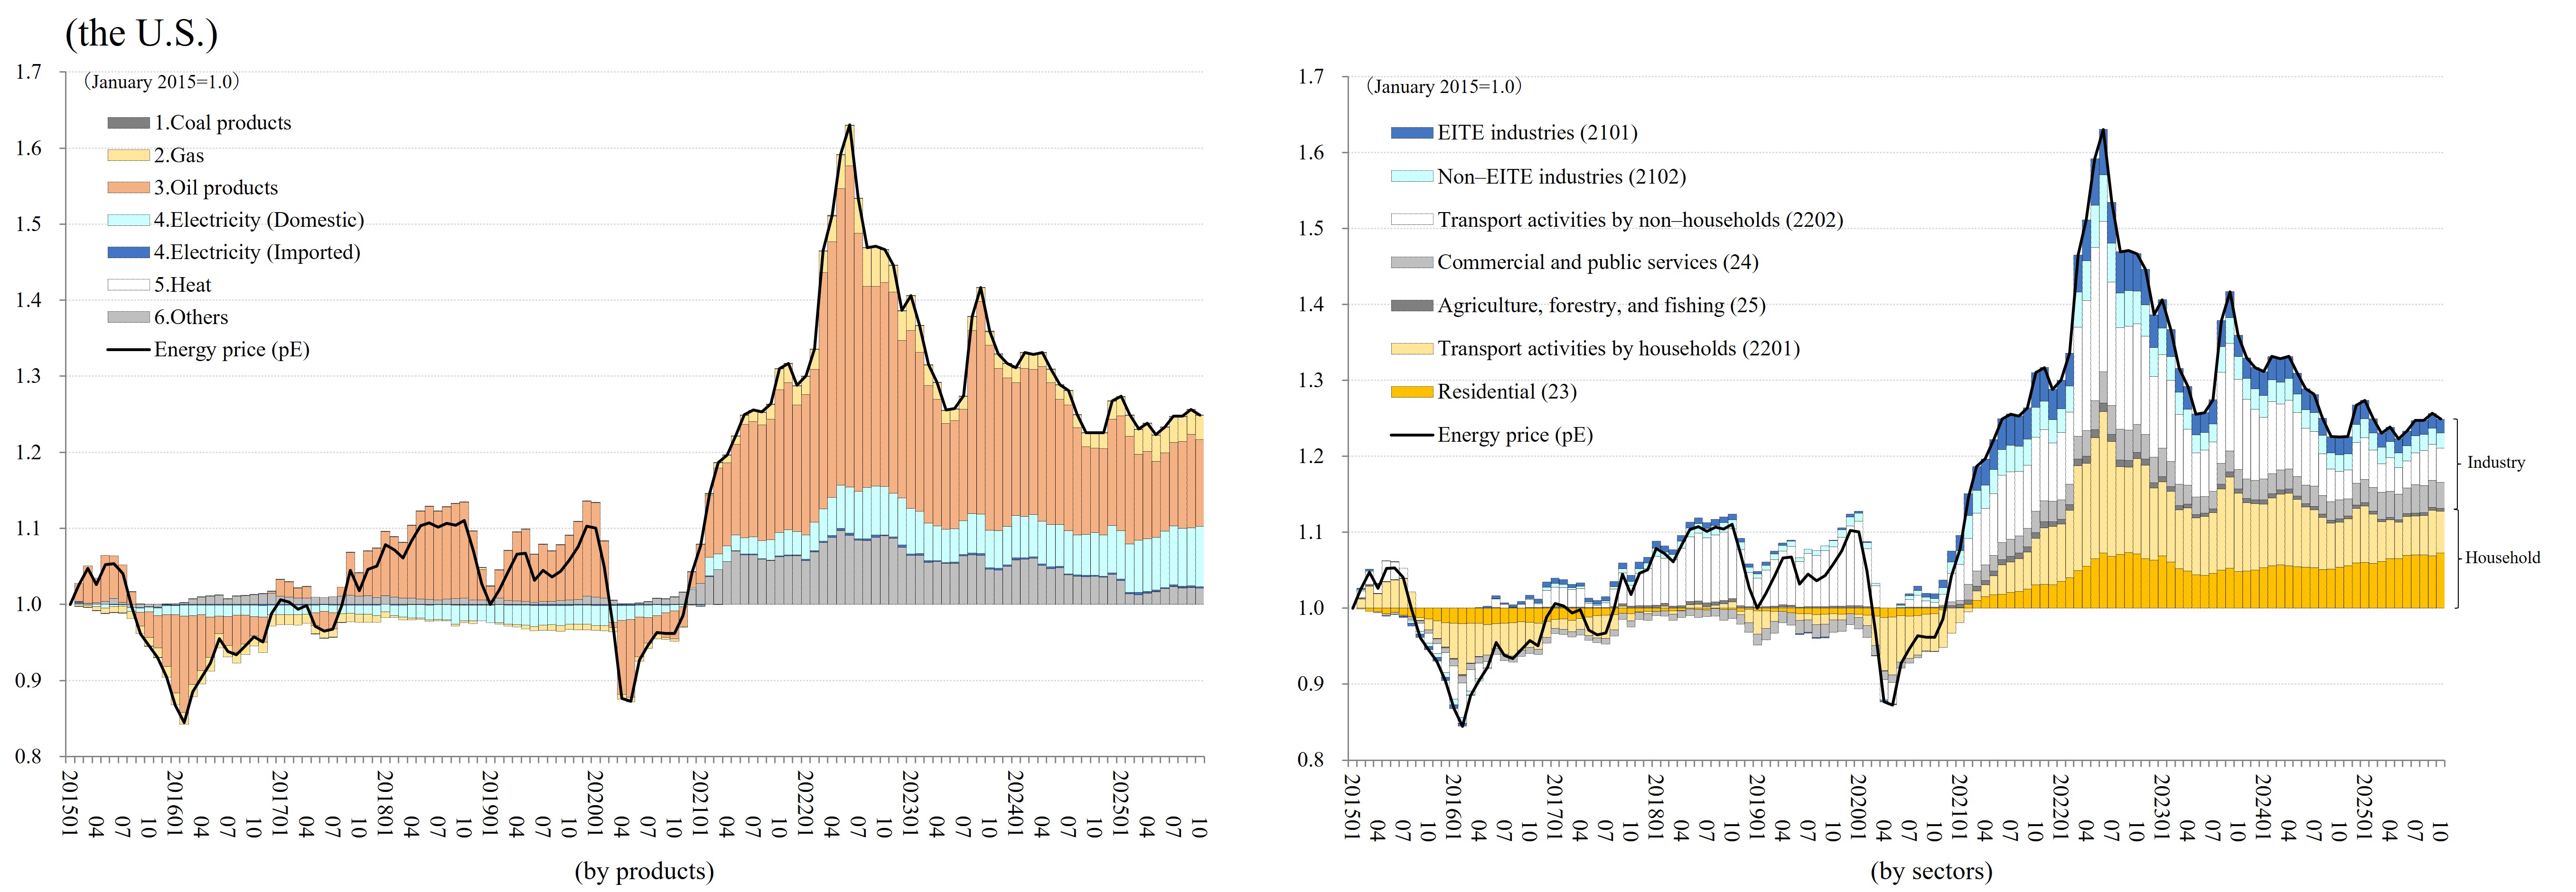
  • While energy prices have declined from their peak, they continue to hover around 20% to 80% above the 2015 level.
  • Except for India and China, EITE output remains sluggish, down by about 7% to 35% from 2015 levels.

Energy Prices

Quality-adjusted Energy Prices for Final Use

Unit: Index (average price at local currency unit in 2015=1.0 in each country). Period: January 2015– July 2025. Notes: Quality-adjusted energy price is defined as the implicit Translog index. The prices are seasonally adjusted and include taxes and subsidies.

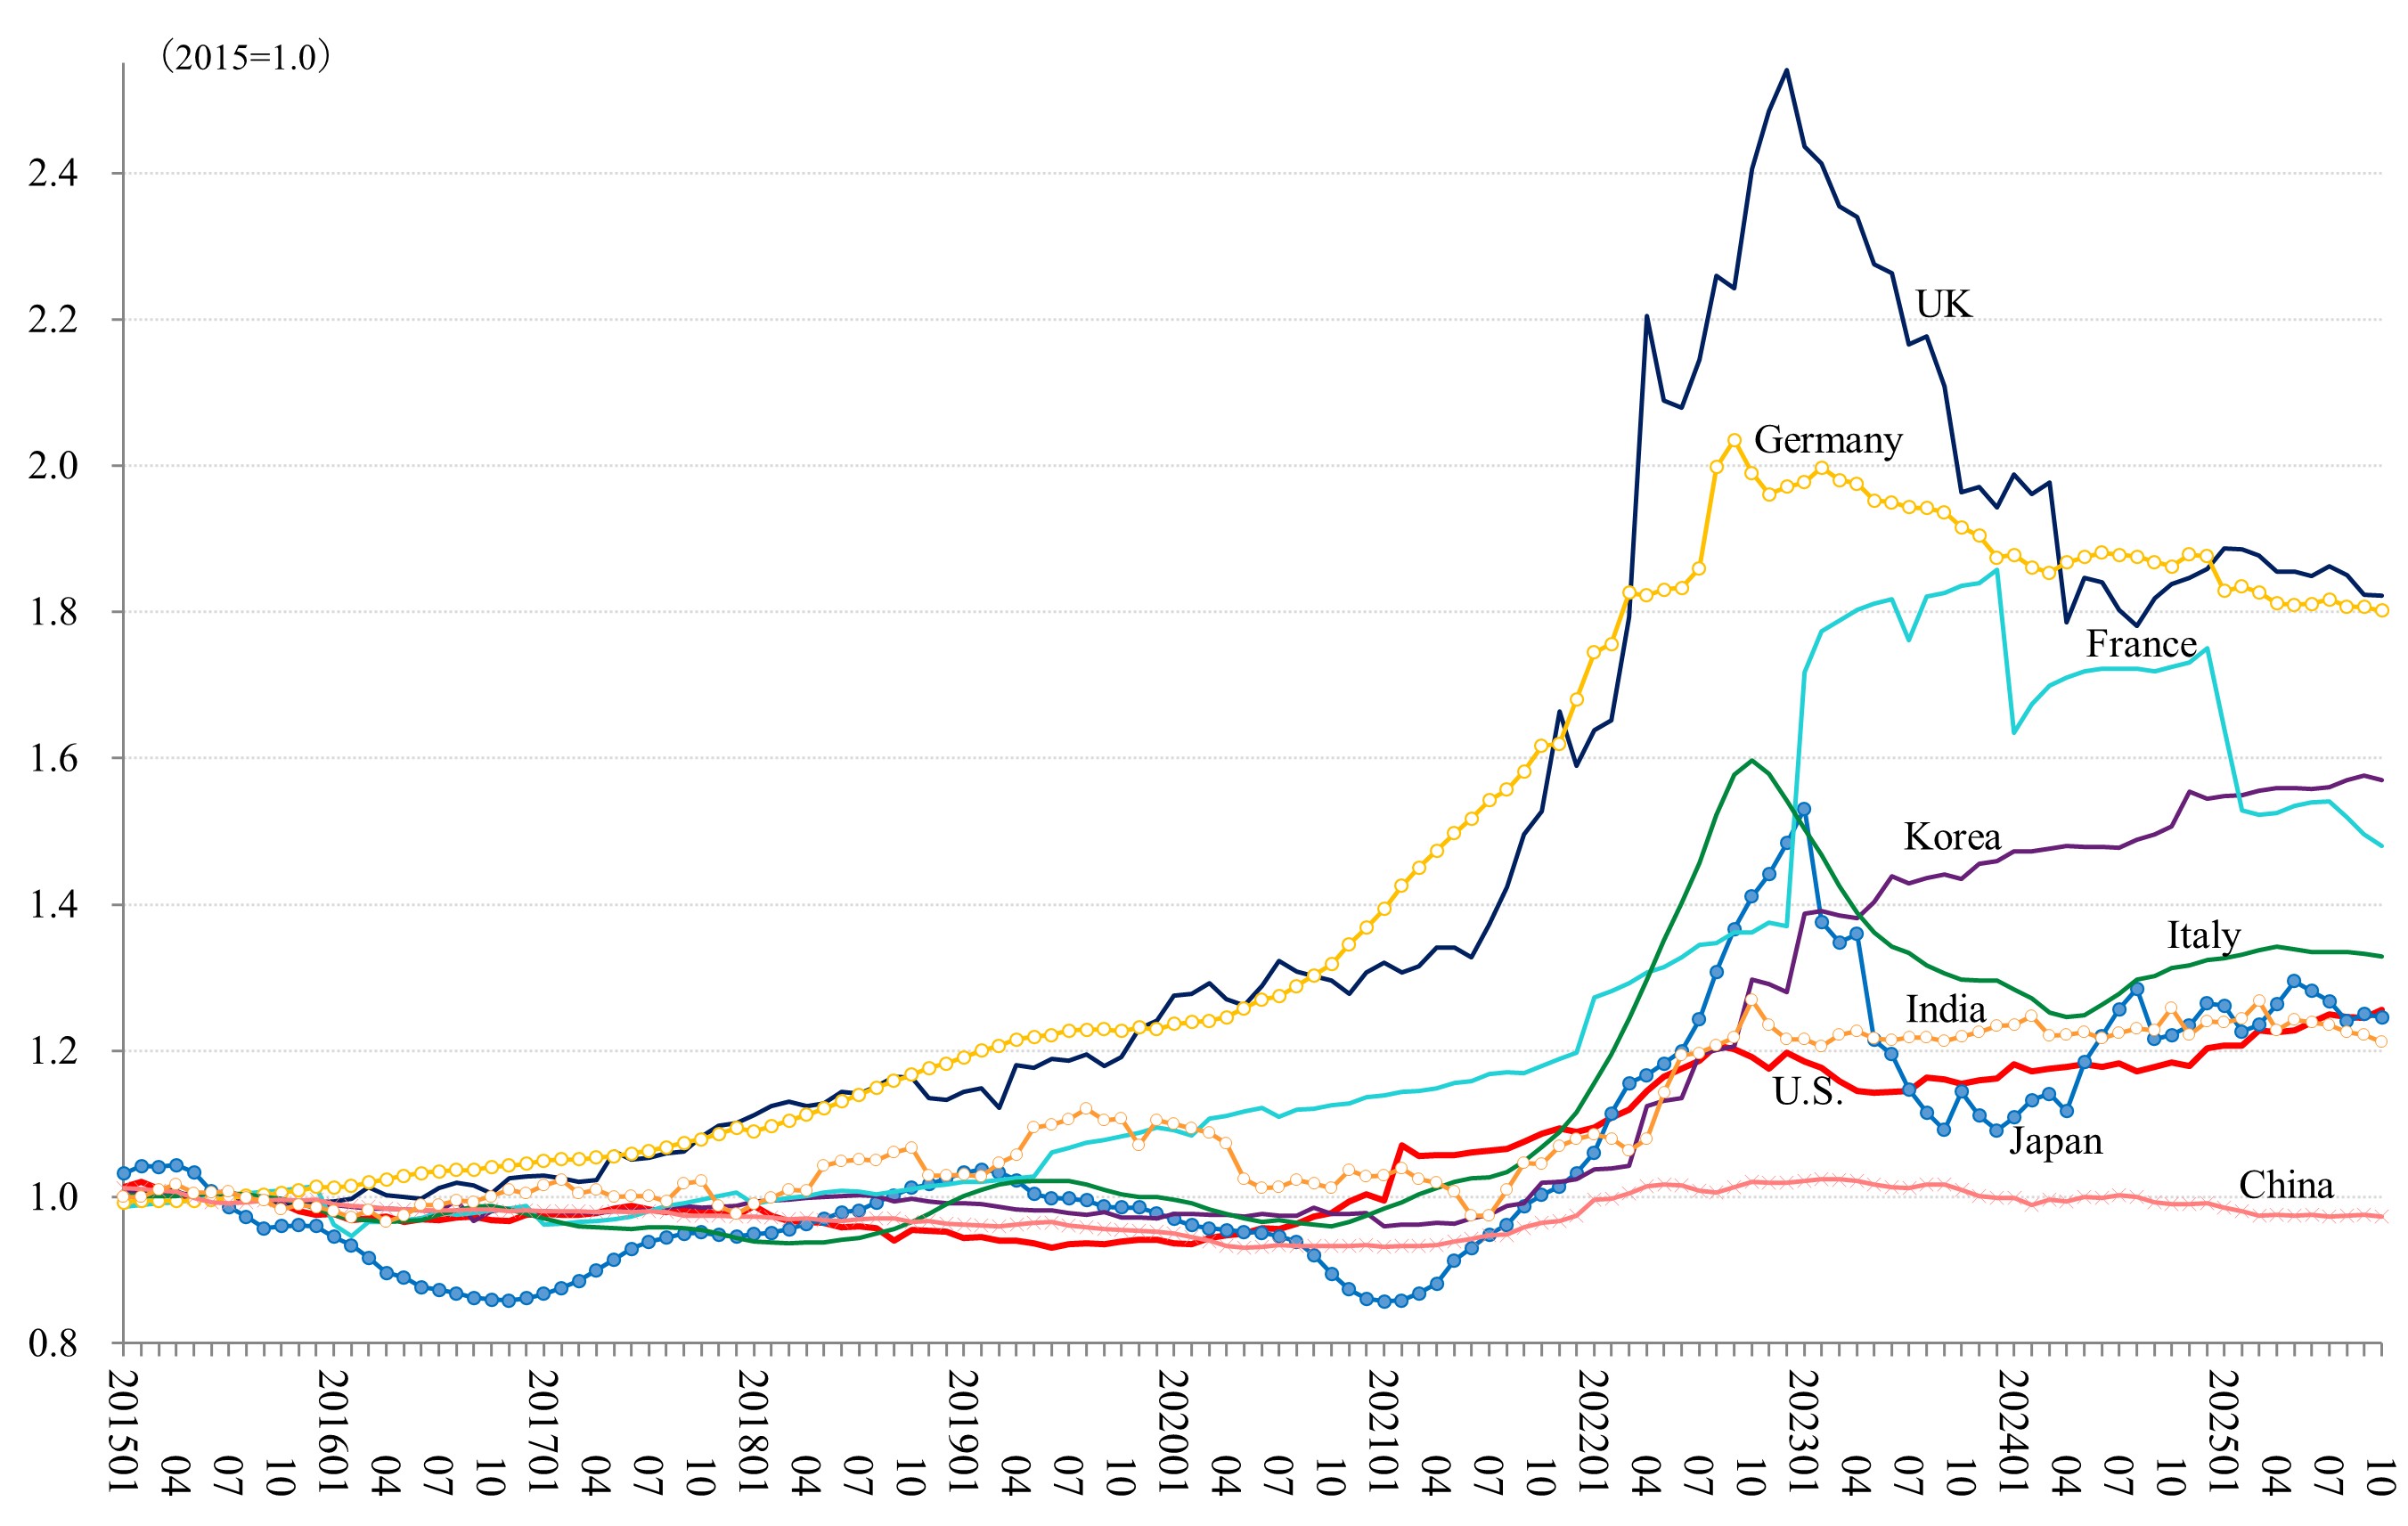
Electricity price

Unit: Index (price at local currency unit in 2015=1.0 in each country). Period: January 2015– July 2025. Notes: Energy price is defined as the implicit Translog index. The prices are seasonally adjusted and include taxes and subsidies

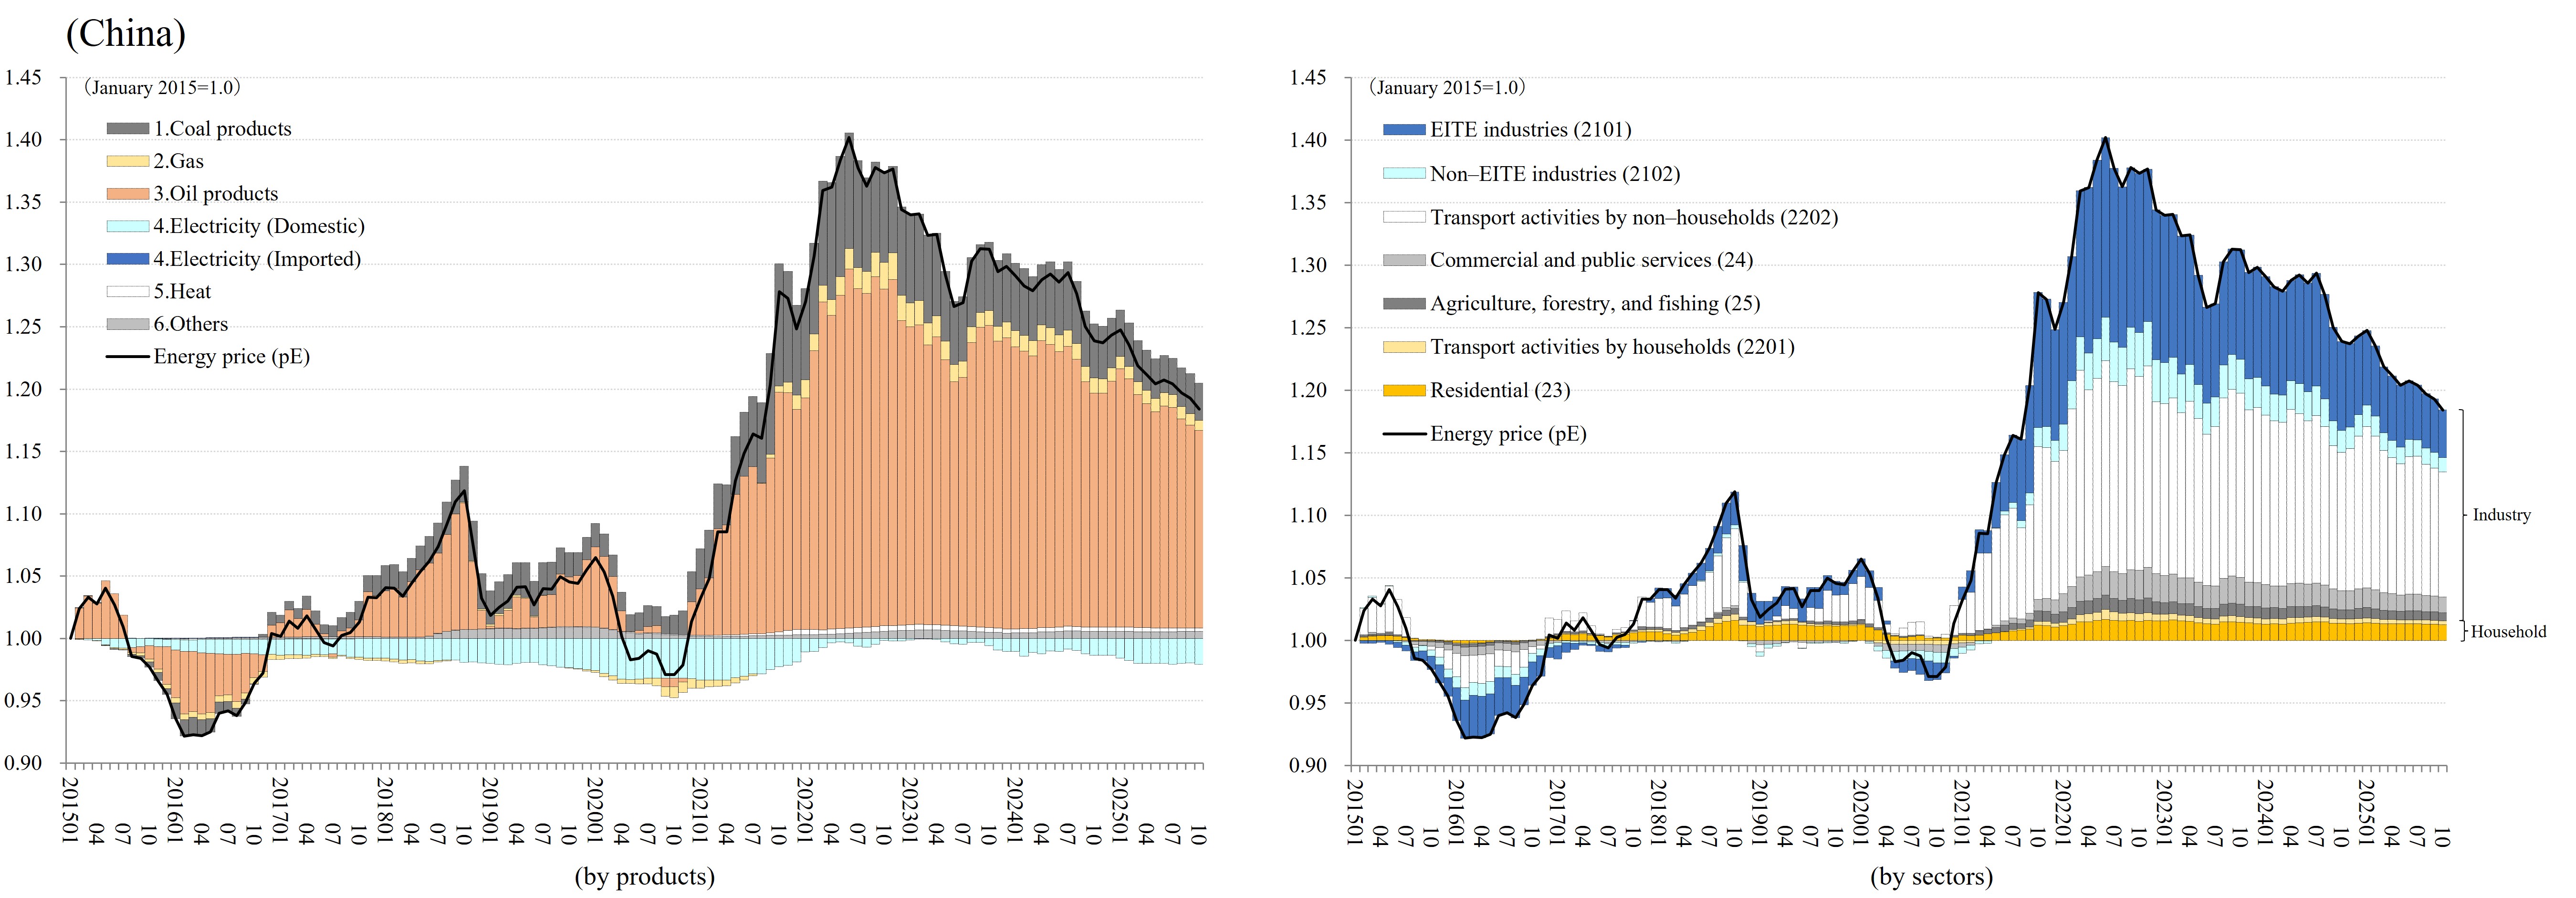
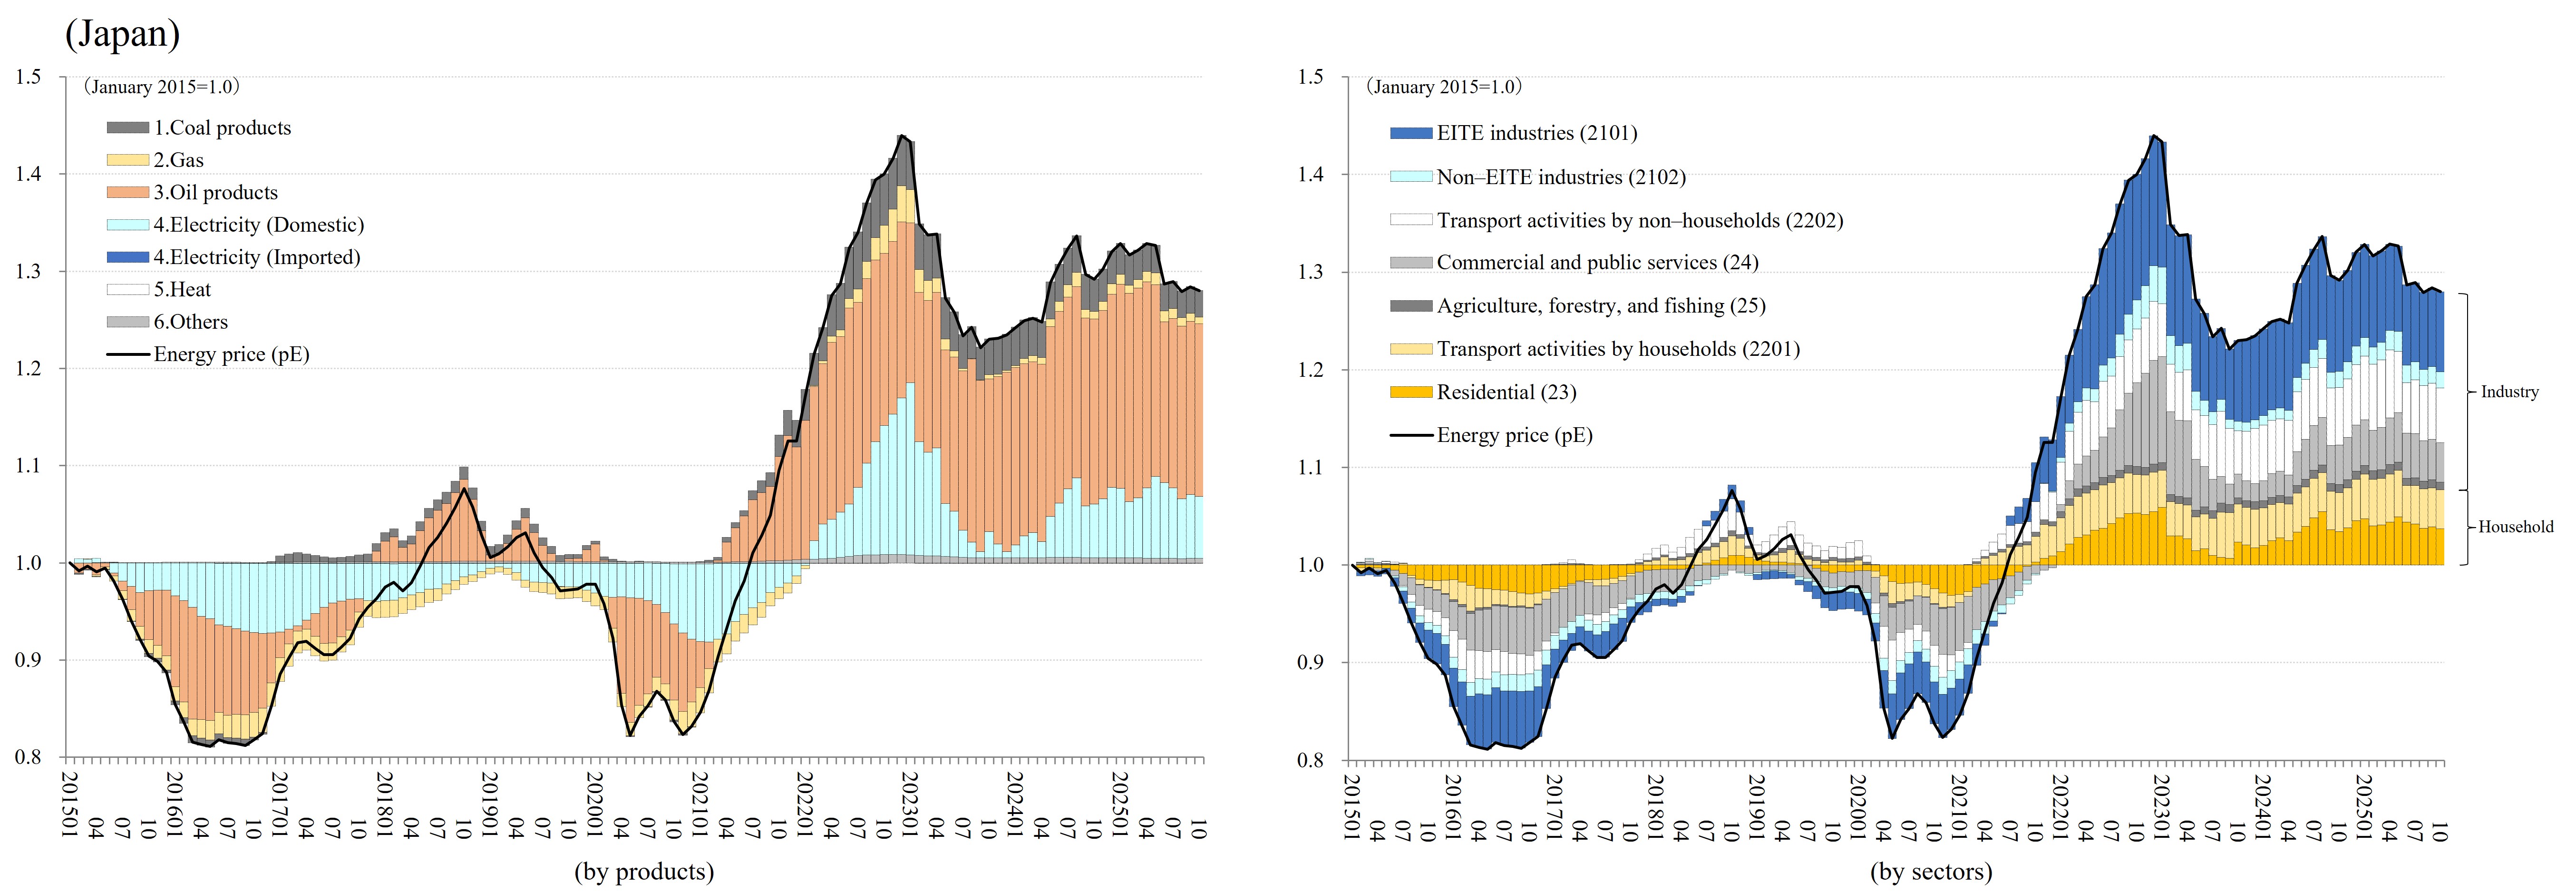
Sources of Energy Price Changes

Asia (China, India, Japan, and Korea)

Unit: Index (price at local currency unit in January 2015=1.0 in each country). Period: January 2015– July 2025. Note: The prices are seasonally adjusted andinclude taxes and subsidies.

EU (France, Germany, and Italy), the UK, and the U.S.

 
Unit: Index (price at local currency unit in January 2015=1.0 in each country). Period: January 2015– July 2025. Note: The prices are seasonally adjusted andinclude taxes and subsidies